IORG Daily Chart ~ Another Strong Week IORG saw
Post# of 2561

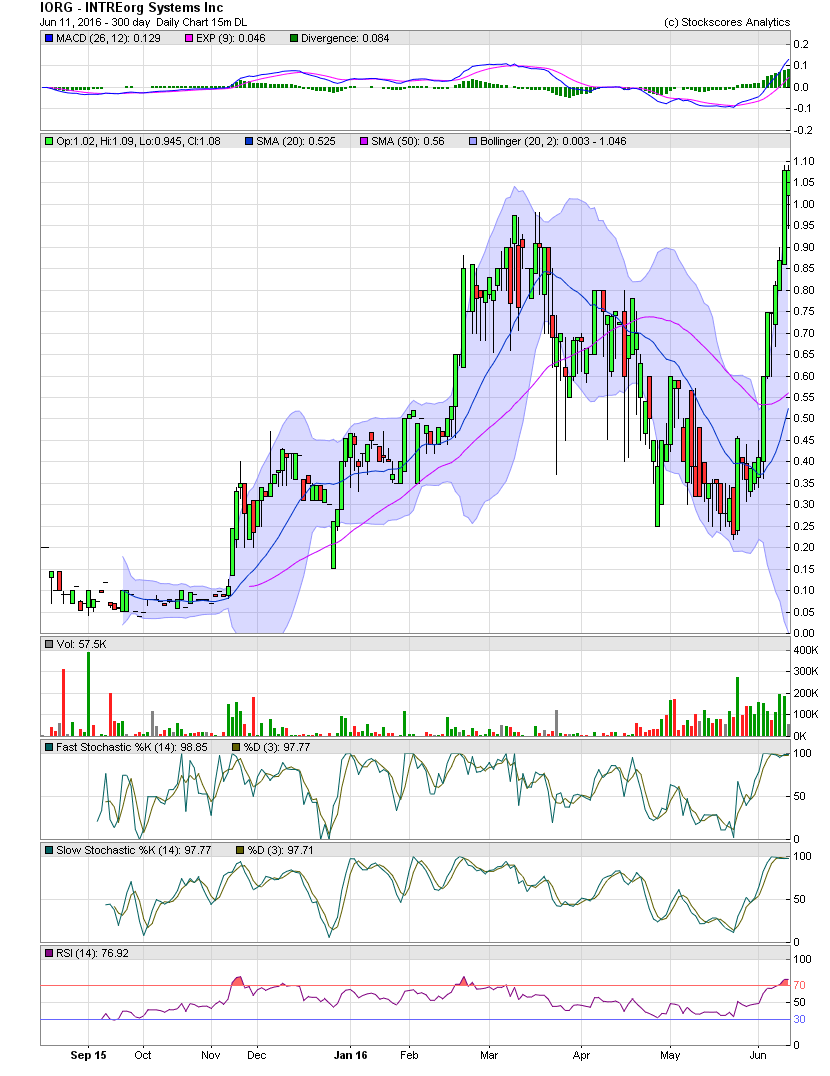
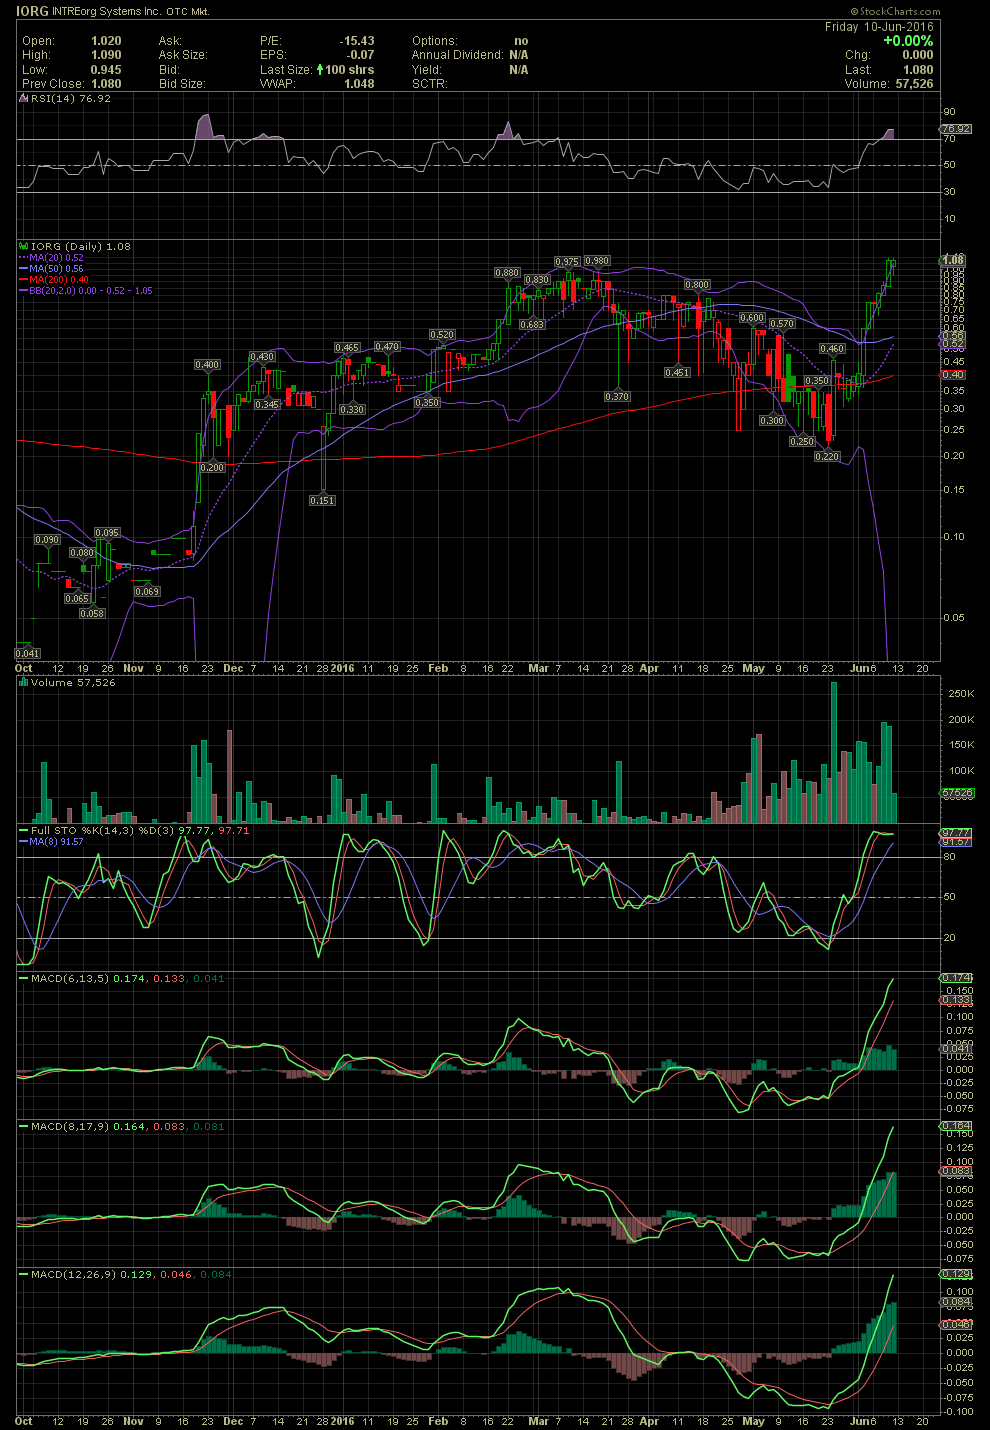
IORG saw another strong week with the stock closing at $1.08 and a new multi year high, not seen since July 2011. On May 23, IORG was trading as low as .22. Previously the stock had fallen from a high of .98 set on May 17. Those that panicked, during the drop to .22 from .97 and sold, have been left behind. Those that have flipped for small gains, during the reversal to the upside, without following the technicals, have also been left behind.
As can be seen on the charts below with the volume sticks, IORG has witnessed a large amount of increased trading volume. All the technicals have moved into overbought levels to include everyone I follow and normally use to make an exit. Because I hold a very large position, I'm at the point where I chose not to take anything off the table. As stated previously, IORG for me is a stock with a holding period of at least 12 months to potentially multiple years. Long term capital gains on IORG is appealing to me, as it is with SNST, RGFR and ATOC. Additionally, if I were to sell a few, I also do not want to be left behind as so many sellers have been over the last three weeks. I rarely break my technical rules of trading, but in this case I simply will hold. The float is far too small and tightly held to risk selling 50k-100k shares while hoping for a re-entry at lower prices. For those of you following along, you can see the RSI and FullSto in their respective nose bleed zones. The MACDs are also nearing very high levels. I will only state, trade as you feel you need to trade. Again, I'll be holding this one for a long time yet. Please do your own DD, chart work, and base your trading decisions on what makes sense to you. If you are along for a long term hold with me and others, you may decide to hold through some volatility. Any pullbacks, and I will more than likely use them to add more shares. The volume on the charts is very telling. GLTA


 (0)
(0) (0)
(0)