MINE Daily Chart, Per a Request....... I was as
Post# of 2561
Posted On: 06/14/2016 10:41:44 PM

MINE Daily Chart, Per a Request.......
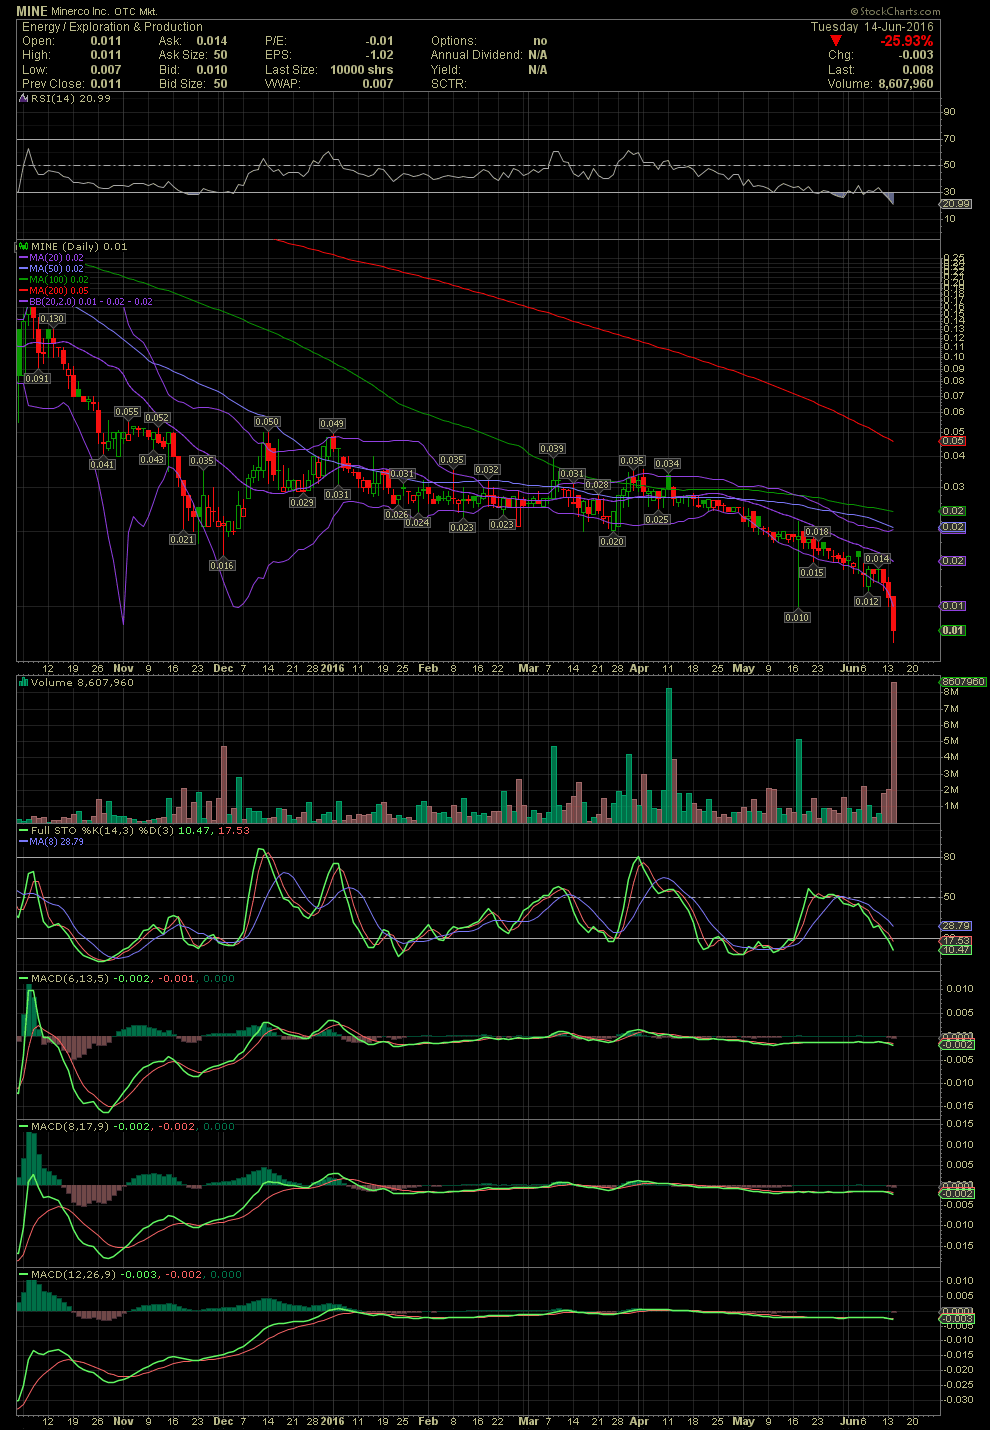
I was asked this evening if I would post a chart and give me thoughts on the technicals for MINE. Unfortunately, I see very little with this chart below that would remotely get me to begin investing at this point. Although I have not taken a glance at the financials, it appears that there have been a few toxic debt conversions underway for months but the looks of the momentum on the chart. I did take a quick look at the share structure. Unless I am mistaken, there was a reverse split of 1:100 in October leaving a float of just over 20MM, and that has increased in just these few short months to over 60MM or 200%. Ouch! That's an incredible increase especially in such a short time after a large RS. I see a decline from almost $12,795 per share which began in the second quarter of 2010. Imagine being an original investor and having held your shares thru today, at nearly $13,000/share to .008 today. The good news, I suppose, is that such an investor will only need to see the stock price appreciate by $12,794.992 per share to break even. That's very sad. Stay on top of your pennies and use the charts. I'm a past statistic, never again!
As to the chart/technicals, there's not much to go on as the MACDs have been flatlined for months as the stock continues to decline. The last three days have seen a dramatic increase in volume into today's explosion of selling with over 8.6MM shares. It sure looks like yet another toxic debt instrument is being converted and sold. The share price hasn't been able to trade appreciably above and of the various MAs, be it the 10, 20, 50, 100 and no where close to the MA200. I have no recommendation either way here and might be wrong, but I personally wouldn't touch MINE at this time. Those of you, following the board, would have been out months ago, in mid to late December with the double top, when the technicals first began to breakdown. Maybe upon the final conversions have been liquidated, the stock might be worth a look should there be any fundamentals developing at the time.
 (1)
(1) (0)
(0)