ATOC Daily Chart ~ A Sharp Move Higher After m
Post# of 2561
Posted On: 06/11/2016 5:53:52 PM

ATOC Daily Chart ~ A Sharp Move Higher
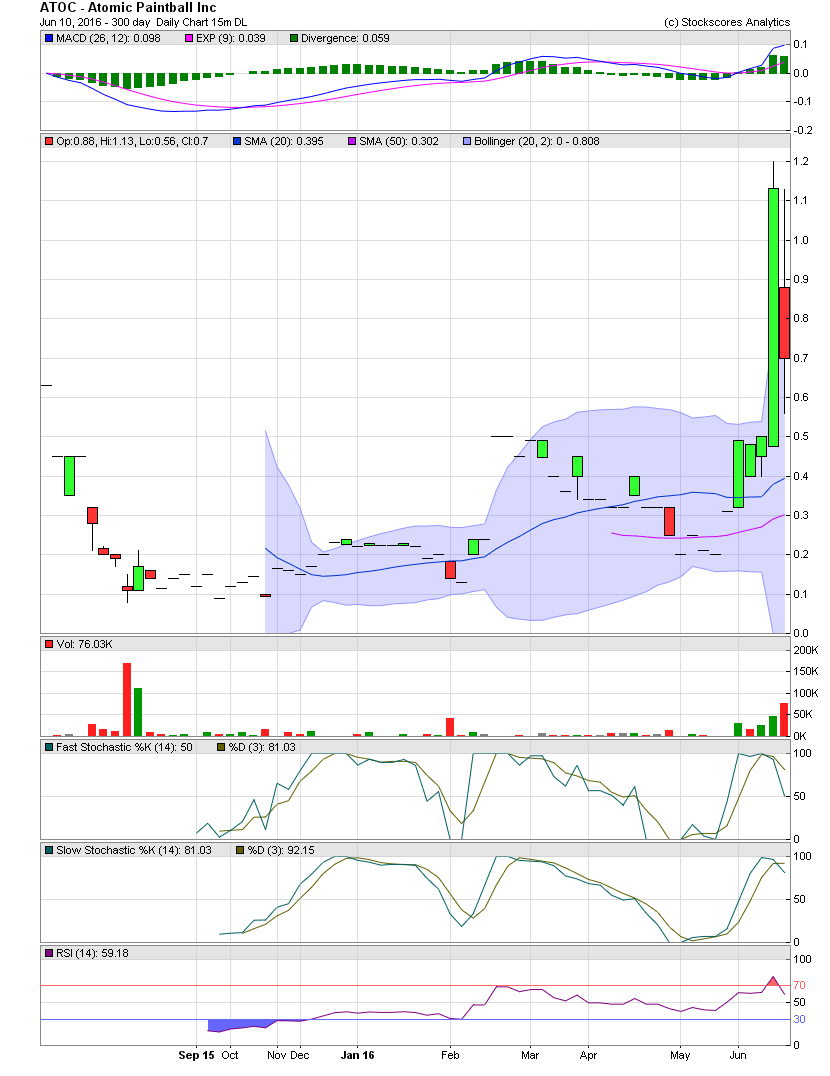
After months of very low volume during an accumulation phase, ATOC woke up on Monday with a low volume move from the low .30s to an intraday high of 1.20 on Thursday. Far too much in a couple of days. The wise decision would be to back off from adding and allow profit takers out at much reduced prices. That happened on Friday as the share price fell from lofty levels to a .70 close. Volume increased to 70.1k while older shareholders likely woke up on Friday to see their long, near dormant stock had risen from the .30s to over 1.00. The normal response, for those not doing any homework, would be to finally exit the stock that they've held for months and even years. The intelligent investor would hold on as obviously something caused the share price to jump fourfold in just one week. Absorbing the sellers on the first leg of a technical breakout is what a chartist would do. The $1.00 to $1.30s have not been seen since the 4th quarter of 2014. Additionally, the volume spike seen this last week has not been seen Sept 2015 during a very large drop in share price to the low teens.
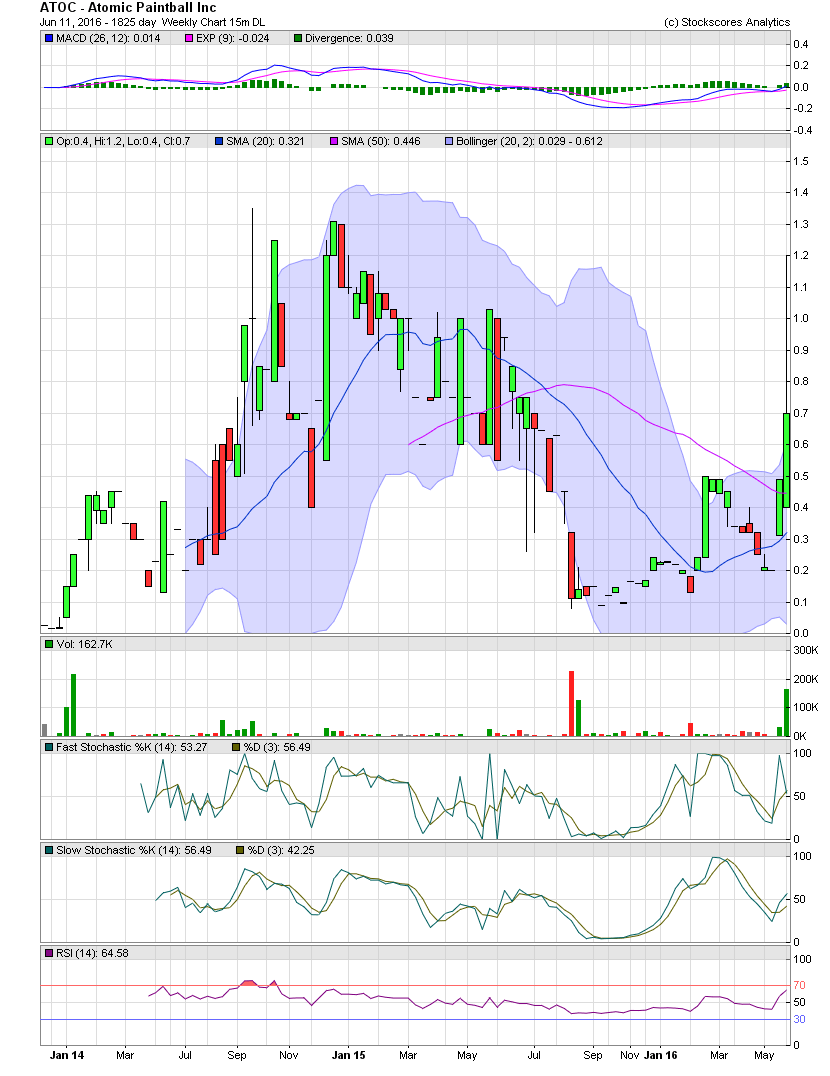
I am sharing two charts below. The first is the Daily with a timeline of approx 10 months. Since one can't see previous trading history on the first chart, the second one is a 2.5 year timeline which shows where the stock was. A break and close above the $1.30/$1.35 area could suggest a very sharp move to the upside since that would represent a 'blue sky' breakout, meaning no upper resistance points in the way. That level is the all time high for ATOC. I also hold a decent position and have a 12-36 month anticipated holding period at this point in time. GLTA
After months of very low volume during an accumulation phase, ATOC woke up on Monday with a low volume move from the low .30s to an intraday high of 1.20 on Thursday. Far too much in a couple of days. The wise decision would be to back off from adding and allow profit takers out at much reduced prices. That happened on Friday as the share price fell from lofty levels to a .70 close. Volume increased to 70.1k while older shareholders likely woke up on Friday to see their long, near dormant stock had risen from the .30s to over 1.00. The normal response, for those not doing any homework, would be to finally exit the stock that they've held for months and even years. The intelligent investor would hold on as obviously something caused the share price to jump fourfold in just one week. Absorbing the sellers on the first leg of a technical breakout is what a chartist would do. The $1.00 to $1.30s have not been seen since the 4th quarter of 2014. Additionally, the volume spike seen this last week has not been seen Sept 2015 during a very large drop in share price to the low teens.
I am sharing two charts below. The first is the Daily with a timeline of approx 10 months. Since one can't see previous trading history on the first chart, the second one is a 2.5 year timeline which shows where the stock was. A break and close above the $1.30/$1.35 area could suggest a very sharp move to the upside since that would represent a 'blue sky' breakout, meaning no upper resistance points in the way. That level is the all time high for ATOC. I also hold a decent position and have a 12-36 month anticipated holding period at this point in time. GLTA
 (0)
(0) (0)
(0)