EFFI Daily Chart ~ An Expensive Lesson in Not Foll
Post# of 2561
Posted On: 03/13/2016 4:36:34 PM

EFFI Daily Chart ~ An Expensive Lesson in Not Following Your Chart
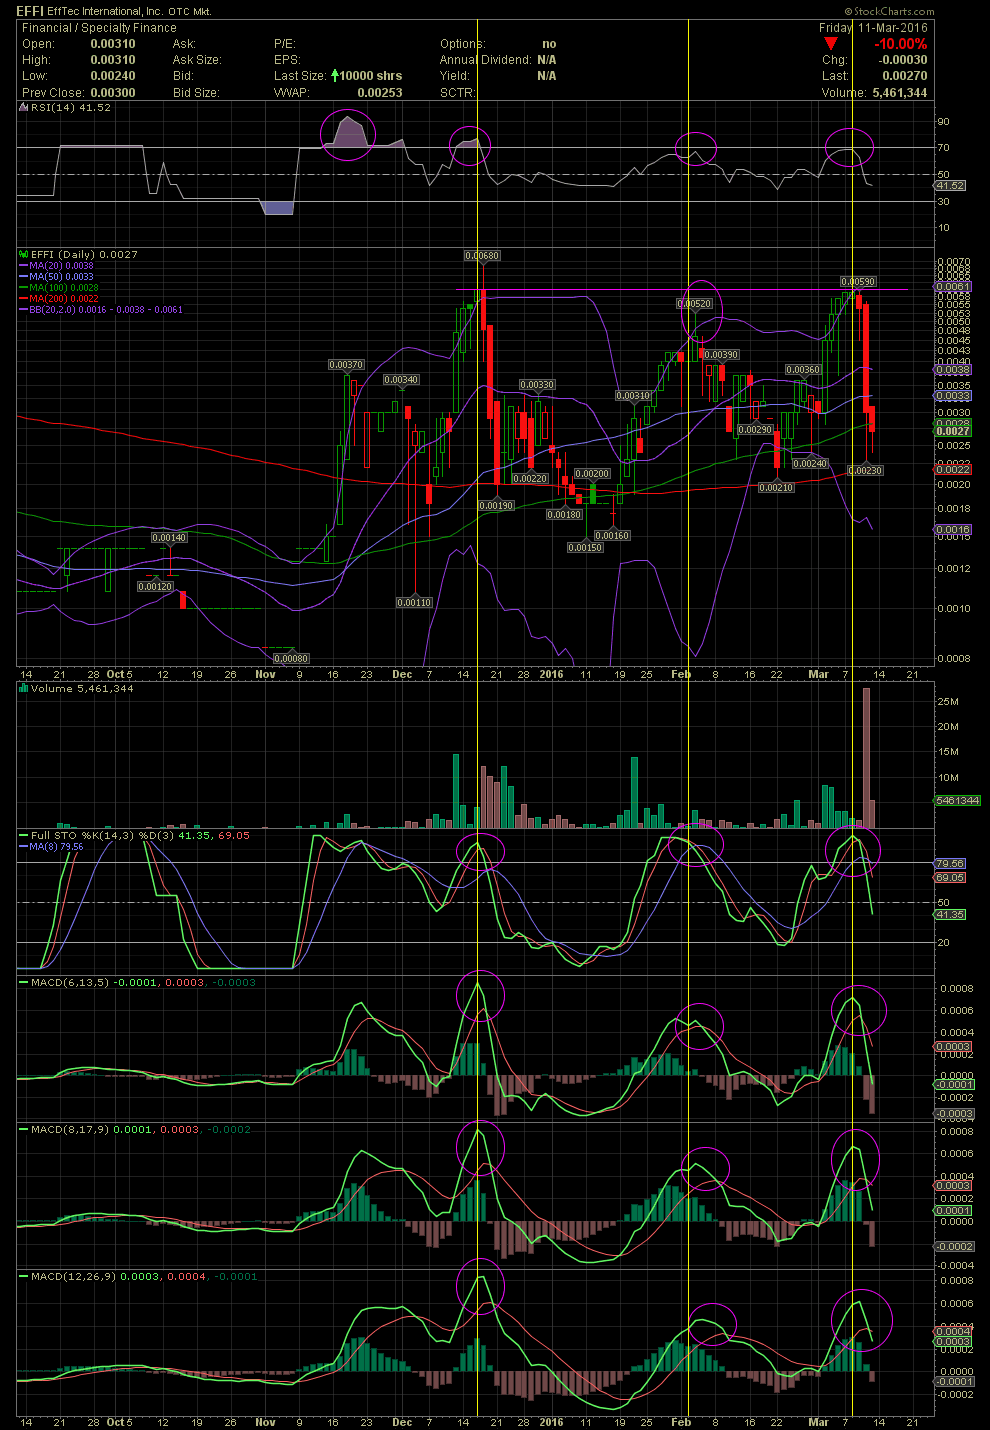
The following chart and technicals for EFFI are classic examples of what can happen with one's investment when they don't follow the charts and technicals. As most technicians/chartists know, chart work very well with the Big Boards and OTC. With the Big Boards, one doesn't have to pay as close attention as with the heavily manipulated OTC. Since the percentage moves in the penny arena are much more dramatic, it is very important to follow the indicators if you are swing trading. If you decide to hold forever, no matter what the momentum shifts show, that's a risk that only the investor has to decide on.
On the chart below, first, look at all the oversold levels of the FullSto and MACDs prior to their moves up, and then check the overbought levels prior to the drops. I drew in some vertical lines (yellow) to better show how technicals line up prior to a selloff. Also of importance is to check the so called 'Power Zone' level of the RSI at or near 70. I'm going to keep pounding it home, the RSI at/near 70+ is NOT a power zone. At best it's a caution sign and the stock price should be closely monitored. My favorite indicators are the FullSto and MACDs. No one knows how far a stock will drop after the Nose Bleed Section is upon you. The stock could simply slow down its ascent, it can begin trending sideways, or it could collapse as EFFI did last week. Learn the technicals. They will assist you in the OTC, for sure.
 (0)
(0) (0)
(0)