RXMD Daily Chart ~ A Sideways Consolidation Transi
Post# of 2561

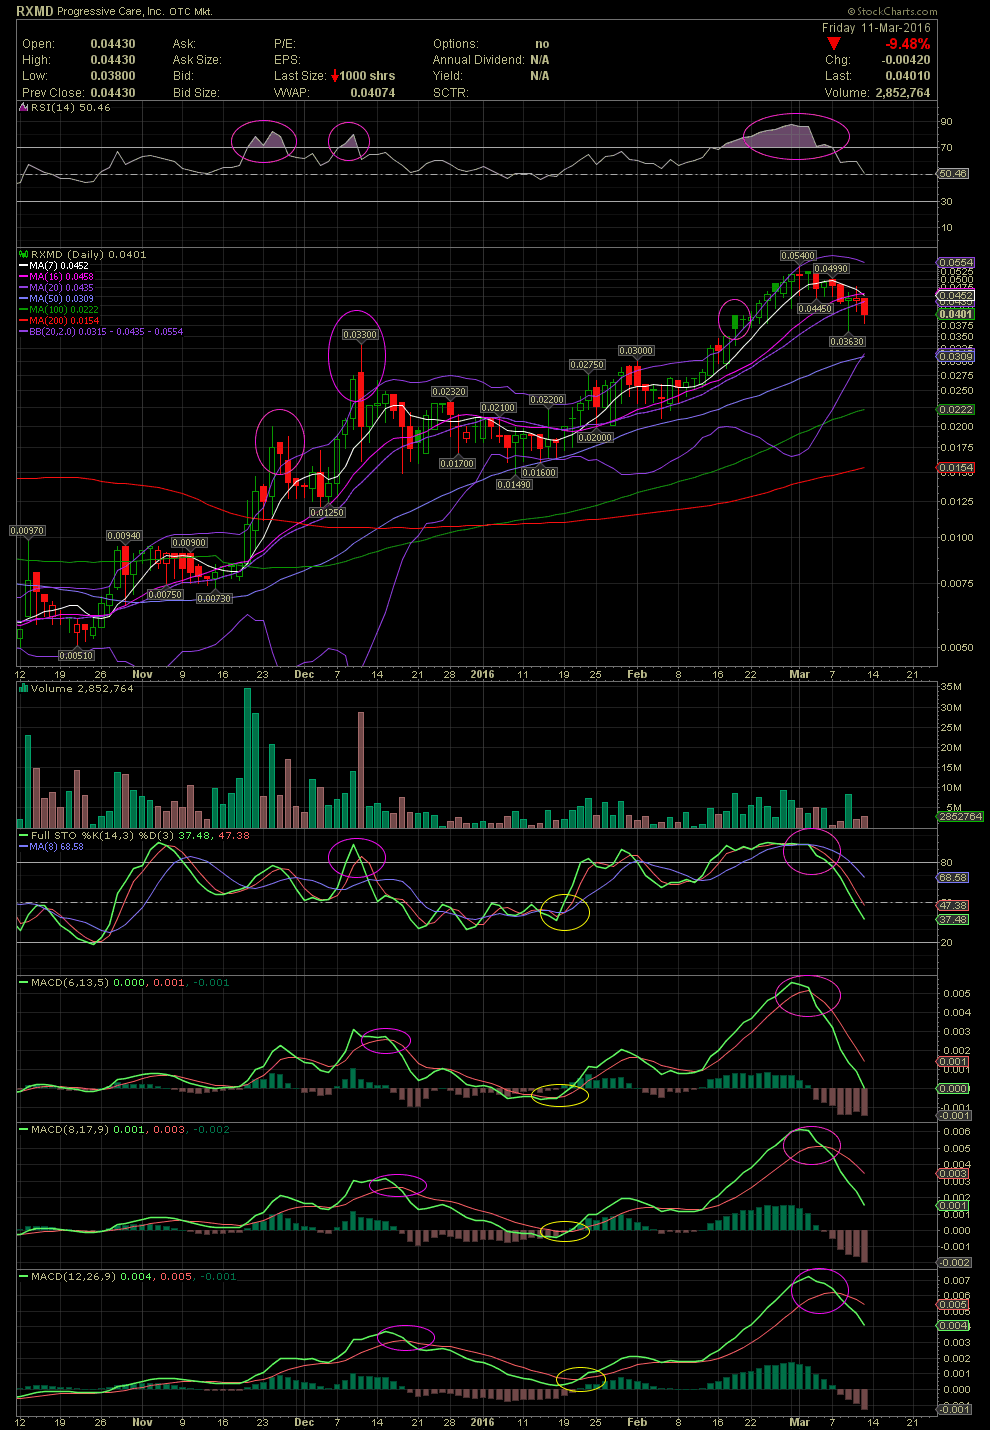
Per the request of six members, here's a chart of RXMD. As I initially mentioned, the stock was trading well into the Nose Bleed Zone of the 70+ RSI. In a very high percentage of success in calling a top with that indicator at very overbought levels. How will the stock trade in the future is always the question. In my previous, I stated that a stock reaching the 70+ area of the RSI might simply slow it's appreciate until the RSI is back under 70. It could trade sideways as RXMD did for a few days. Or it could begin a more pronounced selloff if the FullSto and MACDs are still in lofty levels. To date, it appears RXMD is beginning to transition into a gradual decline. If things play out as I believe might happen, my next target to the downside would be the rising MA50 of .0309. By the way, that .03 level is also the previous top prior to the last leg up. A previous high becomes a support level once broken above. Whether it gets there or not is yet to be seen. With the 12D MACD still at fairly overbought levels, barring any major news, I believe the odds favor a further decline. Overbought levels of the indicators on any chart should be listened to. I took a little bit of heat a few days back because of my opinion of the lofty levels, but we'll see how things play out. I wasn't bashing the stock, but I did sell my first 60% at and average of .042 and the balance on the bounce back to the high .04s. Everyone following along here, knows that I shifted those profits into IORG at .50-.52, which is now sitting at .90. In hindsight, a nice move. And THAT'S what using charts and technicals is all about. Had IORG been sitting with very overbought technicals, I would have moved into another stock or just waited for the next bus to come along. GLTA

 (0)
(0) (0)
(0)