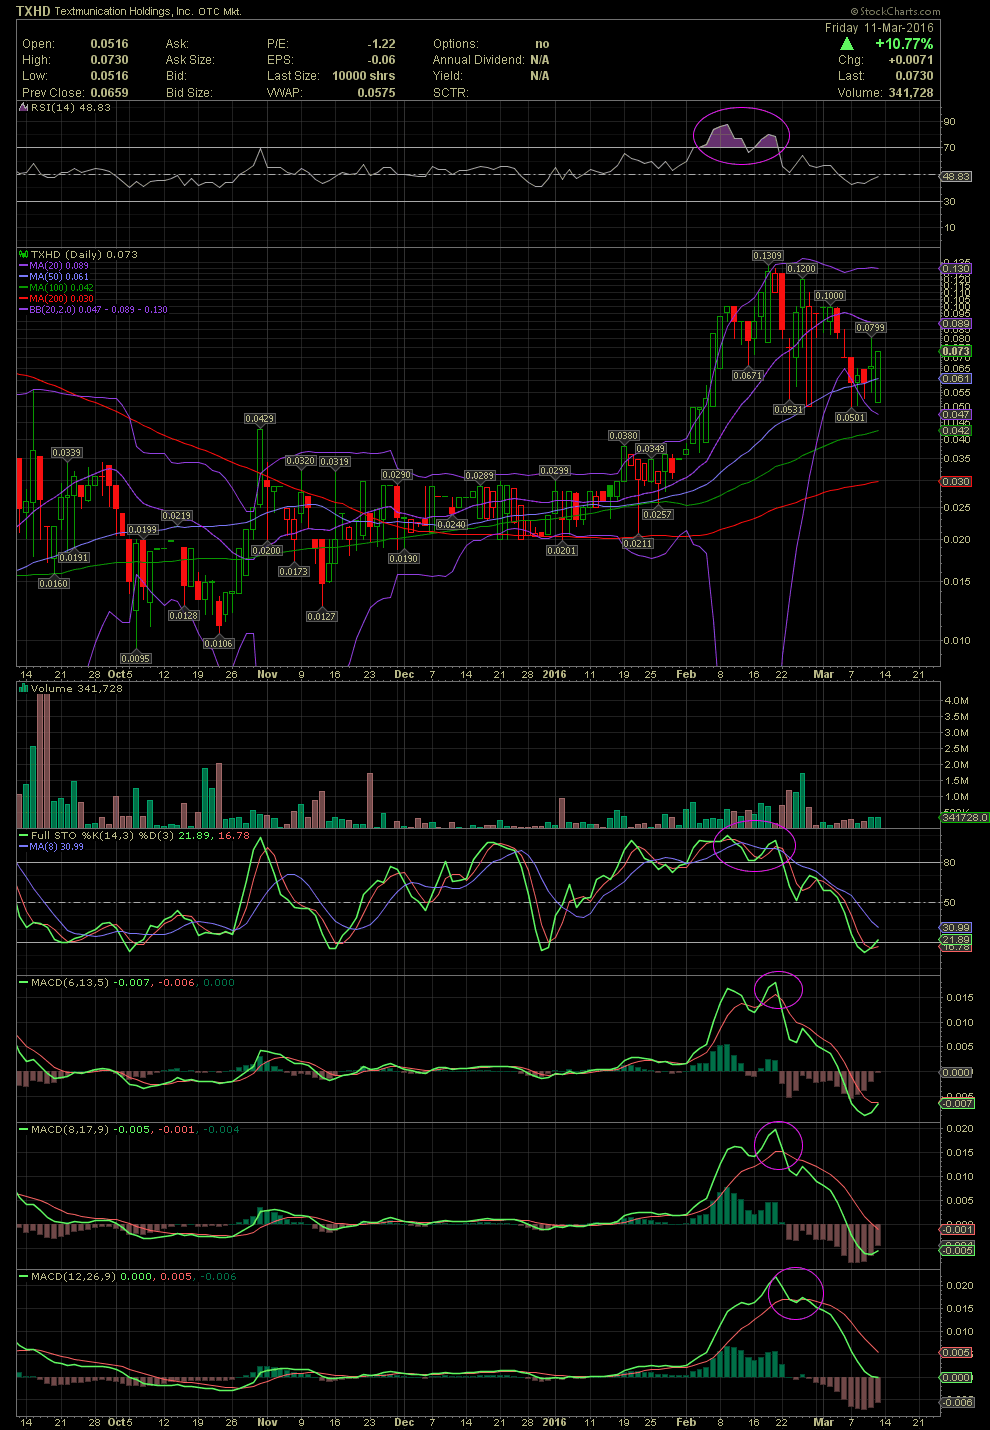
TXMD Daily Chart ~ A Lot of Chatter About This One
Post# of 2561

TXMD has been blasted all over message boards and Skype rooms for almost two months now. Had one followed the chart and technicals, they would have entered the stock in mid January for a great entry just when the FullSto and MACDs began their positive crossovers. The stock was trading in the .02s/.03s. As the stock increased to the .10 area, it's important to take note of where the RSI had risen to. As I have pointed out often, the level of 70 and higher should raise at a minimum a caution sign. Scroll down and check the positions of the FullSto and MACDs. They were also entering very overbought levels, especially the FullSto. Do not use just one of these indicators as an entry or exit. Should they all begin to show the same oversold or overbought levels, it is very prudent to take a few or all off the table. As was the case with TXMD, those levels from .10 to .13 was the top. The stock then corrected to the low .05s. The skeptics will call it hindsight, yet those understanding all aspects of the various levels of indicators, know it they are telegraphing potential shifts in momentum and direction. TXMD is now attempting to put in a bottom, which may be in already. Those that took profits while the RSI and the rest of the indicators were in the Nose Bleed Zone did very well.

 (0)
(0) (0)
(0)