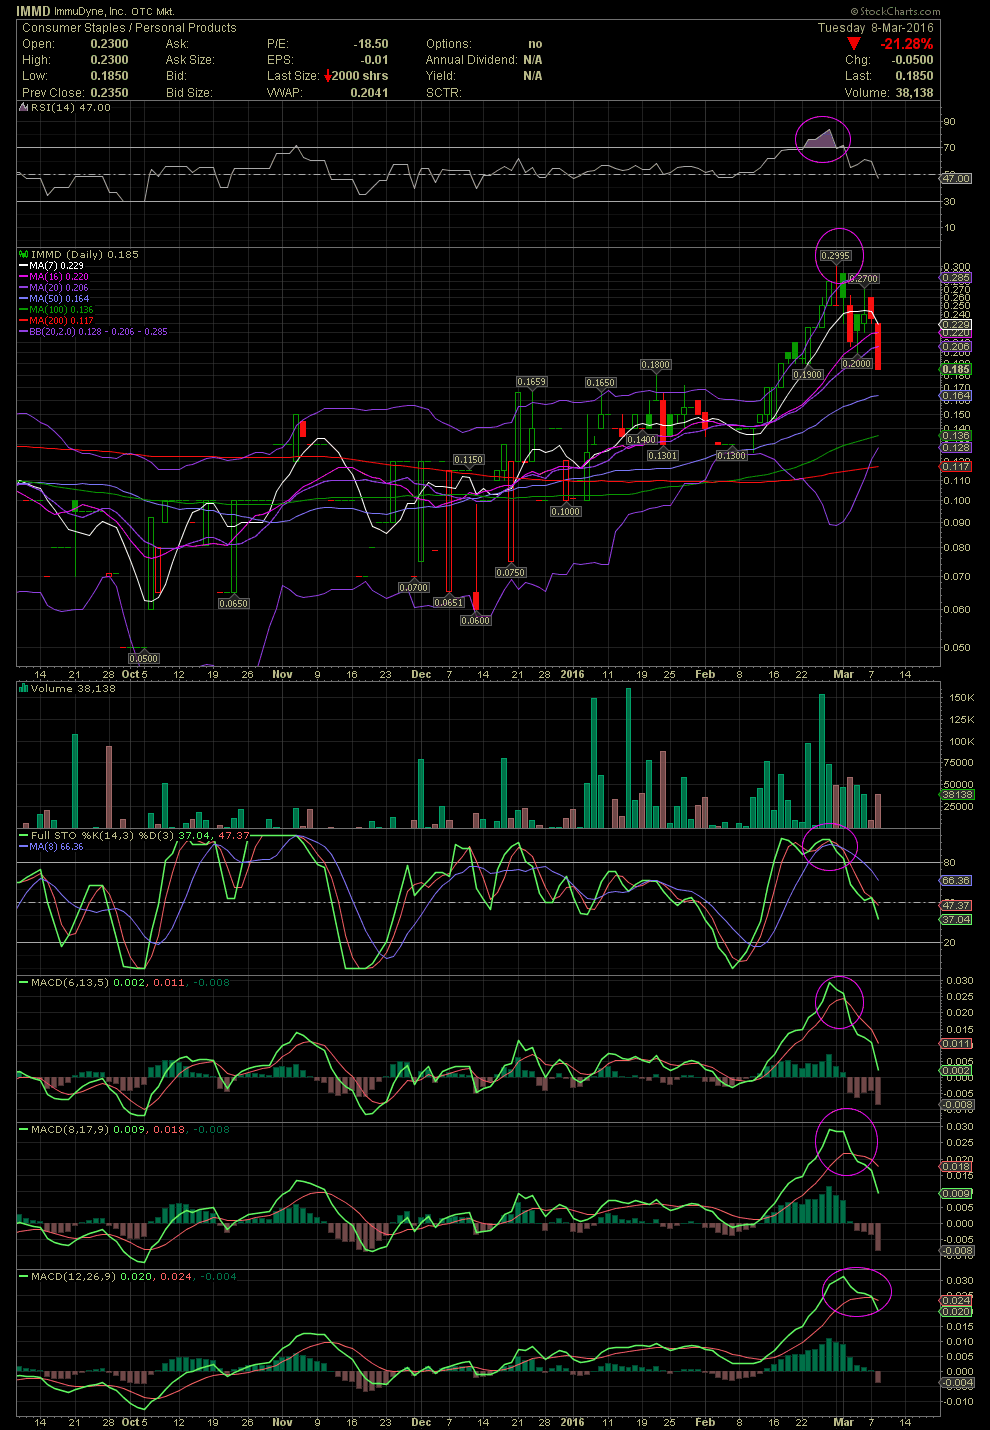
IMMD Daily Chart ~ Retreating from Overbought Indi
Post# of 2561

A friend of mine with a substantial position in IMMD asked for a chart and if an RSI in the overbought levels of 70+ is a sell signal. Yes it is, but one can not simply only look at the RSI. Also following the FullSto and MACDs.
In the chart below, one can follow the progress even in an extremely tightly held stock such as IMMD. Anyone who peeled a few off when the so called 'Power Zone' of the RSI traded into the 70 level and higher, which is the Nose Bleed Zone and nothing else, did well. No one has to wait for the technicals to reset, unless there is earth shattering news. But if one had sold a few or all up near .30, then these .18s would be a nice re-entry. As I have mentioned many times, use the charts and technicals to better assist your overall returns in the stock market. Great tools, but not guarantees.

 (0)
(0) (0)
(0)