MFST Daily Chart ~ Sell Off After Trading in the O
Post# of 2561
Posted On: 03/09/2016 10:37:25 AM

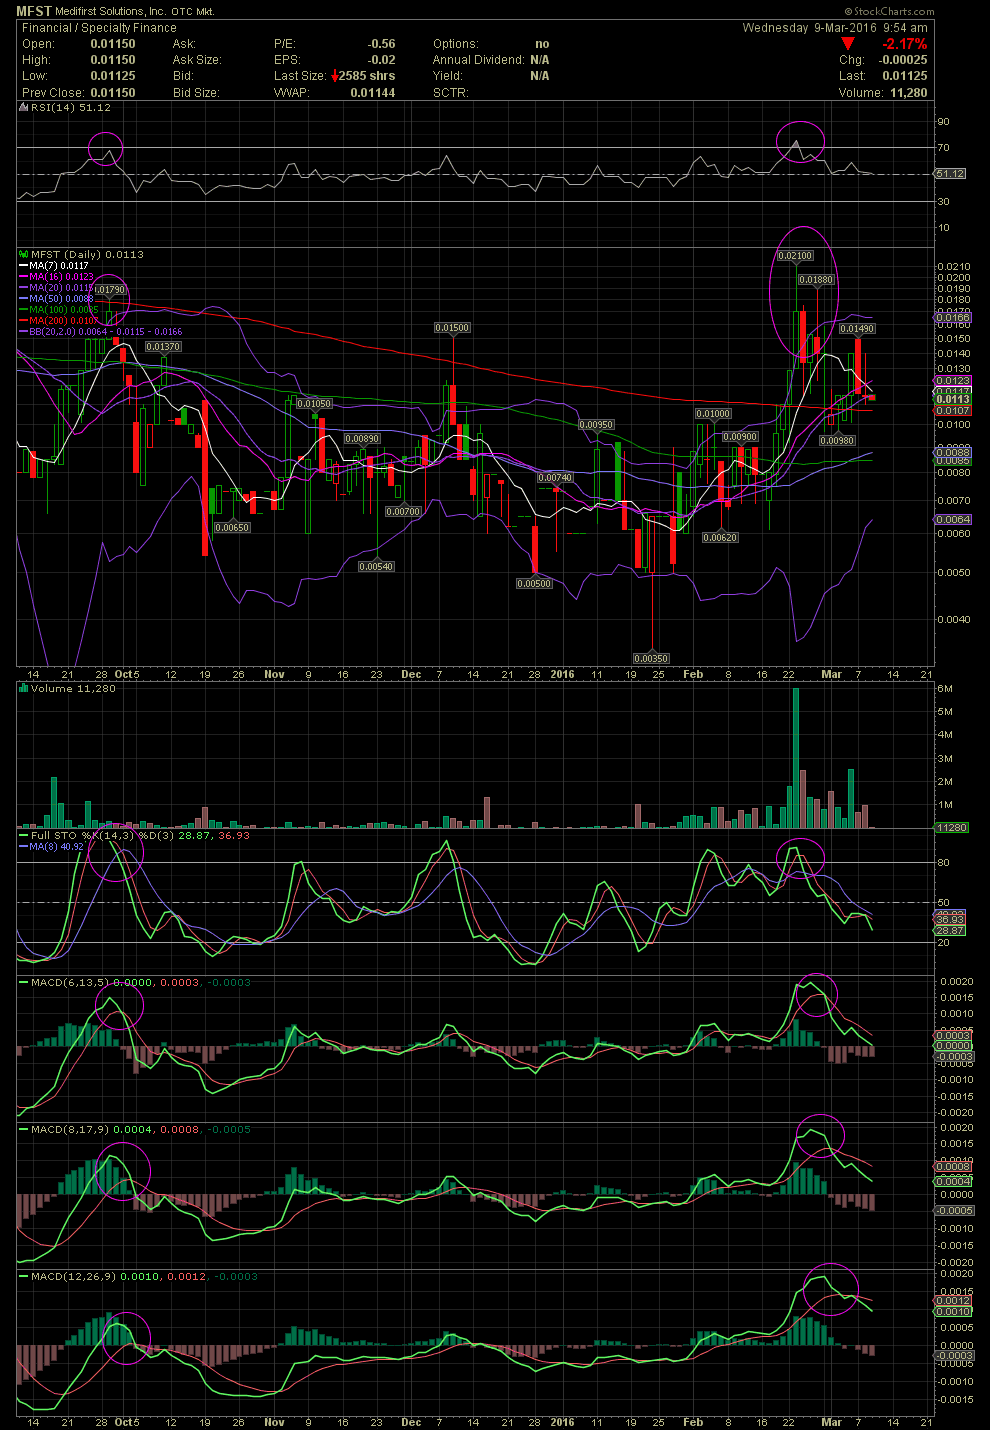
MFST Daily Chart ~ Sell Off After Trading in the Overbought Levels
I was asked for a chart on IMMD. Here's another situation that if one had followed the technicals trading into the overbought levels of the RSI, FullSto and MACDs, they would have taken a few profits and waited for a reset. I don't have to explain much as I have circled the appropriate indicators, their overbought levels, and the subsequent crossovers to the negative side. I'm beginning to get quite a few requests now with similar technical positions. So the discussions last week of the RSI being a caution flag rather than the mis-termed power zone, has been of help to quite a few per message. GLTA
I was asked for a chart on IMMD. Here's another situation that if one had followed the technicals trading into the overbought levels of the RSI, FullSto and MACDs, they would have taken a few profits and waited for a reset. I don't have to explain much as I have circled the appropriate indicators, their overbought levels, and the subsequent crossovers to the negative side. I'm beginning to get quite a few requests now with similar technical positions. So the discussions last week of the RSI being a caution flag rather than the mis-termed power zone, has been of help to quite a few per message. GLTA
 (0)
(0) (0)
(0)