RXMD Daily Chart ~ A Follow Up on Last Week's Char
Post# of 2561
Posted On: 03/08/2016 12:34:06 PM

RXMD Daily Chart ~ A Follow Up on Last Week's Chart Post
I received a lot of messages regarding the discussions of the RSI last week and what many incorrectly call the 'Power Zone'. When it comes to technical indicators posted on this board, should information be incorrectly presented, I will correct it, point it out, and explain why that information is incorrect, as I did.
First of all, please do not consider my charts and technicals on any stock I post about as a buy or sell recommendation, and especially don't take my opinions of when a stock is technically overbought as a bash. I certainly was not bashing RXMD simply because I mentioned that imo it was overbought and that I sold a few. Please link back to my post Feb 28 in which I mentioned that the RSI was extremely overbought when it was trading above 70. Here's the link to my post:
http://investorshangout.com/post/view?id=3581762
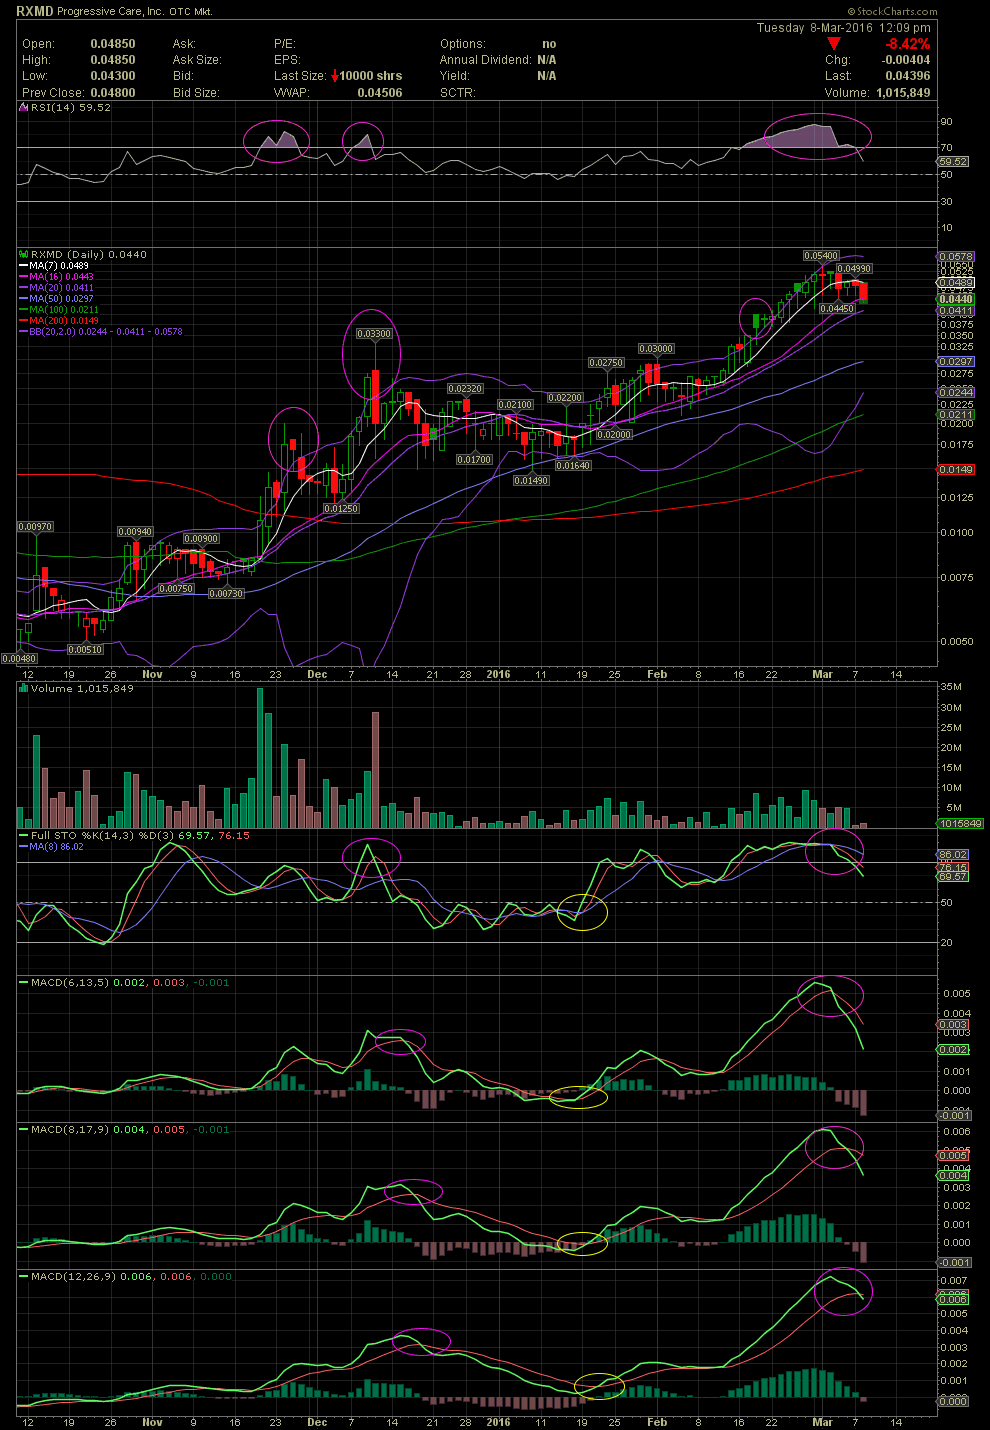
Below is today's chart for a comparison to the chart in my post of Feb 28.
I also shared a couple of links to the individual who developed the RSI indicator. The simple fact of the matter is that the RSI at 70 and higher is NOT a power zone, it is a caution sign that one should be aware of an impending stall in the share price, be it through consolidation or an outright correction.
Please review my above link to my RXMD Daily Chart post and then look at where the RSI was and is today. The stock closed at .049 on the day of my post. It did trade to .054, but when the RSI is in the correctly termed 'The Nose Bleed Section' of 70+, it is time to peel a few off, if not all. I sold the balance of my RXMD on that slight rebound after the correction began. Additionally, please note that the FullSto and MACDs have all crossed over to the downside. Does all this mean that RXMD will fall dramatically? No. All the indicators of Feb 28 were showing me that a possible change of momentum was about to occur. From .054 to .043 so far, and I would say that my move of protecting profits for anyone taking a few off the table when the RSI was way overbought was correct. And what I chose to do with my profits was to roll them into IORG at .50-.52 which is now trading at .92.
Charts and technicals are tools and not guarantees. But they are approx 95% accurate for me. So I will continue to use them on my board here, and if I read a post that contains incorrect verbiage of an indicator, I will correct it.
Take Care
BT
I received a lot of messages regarding the discussions of the RSI last week and what many incorrectly call the 'Power Zone'. When it comes to technical indicators posted on this board, should information be incorrectly presented, I will correct it, point it out, and explain why that information is incorrect, as I did.
First of all, please do not consider my charts and technicals on any stock I post about as a buy or sell recommendation, and especially don't take my opinions of when a stock is technically overbought as a bash. I certainly was not bashing RXMD simply because I mentioned that imo it was overbought and that I sold a few. Please link back to my post Feb 28 in which I mentioned that the RSI was extremely overbought when it was trading above 70. Here's the link to my post:
http://investorshangout.com/post/view?id=3581762
Below is today's chart for a comparison to the chart in my post of Feb 28.
I also shared a couple of links to the individual who developed the RSI indicator. The simple fact of the matter is that the RSI at 70 and higher is NOT a power zone, it is a caution sign that one should be aware of an impending stall in the share price, be it through consolidation or an outright correction.
Please review my above link to my RXMD Daily Chart post and then look at where the RSI was and is today. The stock closed at .049 on the day of my post. It did trade to .054, but when the RSI is in the correctly termed 'The Nose Bleed Section' of 70+, it is time to peel a few off, if not all. I sold the balance of my RXMD on that slight rebound after the correction began. Additionally, please note that the FullSto and MACDs have all crossed over to the downside. Does all this mean that RXMD will fall dramatically? No. All the indicators of Feb 28 were showing me that a possible change of momentum was about to occur. From .054 to .043 so far, and I would say that my move of protecting profits for anyone taking a few off the table when the RSI was way overbought was correct. And what I chose to do with my profits was to roll them into IORG at .50-.52 which is now trading at .92.
Charts and technicals are tools and not guarantees. But they are approx 95% accurate for me. So I will continue to use them on my board here, and if I read a post that contains incorrect verbiage of an indicator, I will correct it.
Take Care
BT
 (0)
(0) (0)
(0)