INDU Daily Chart ~ Basic Indicators Here's a si
Post# of 2561
Posted On: 03/06/2016 1:09:42 AM

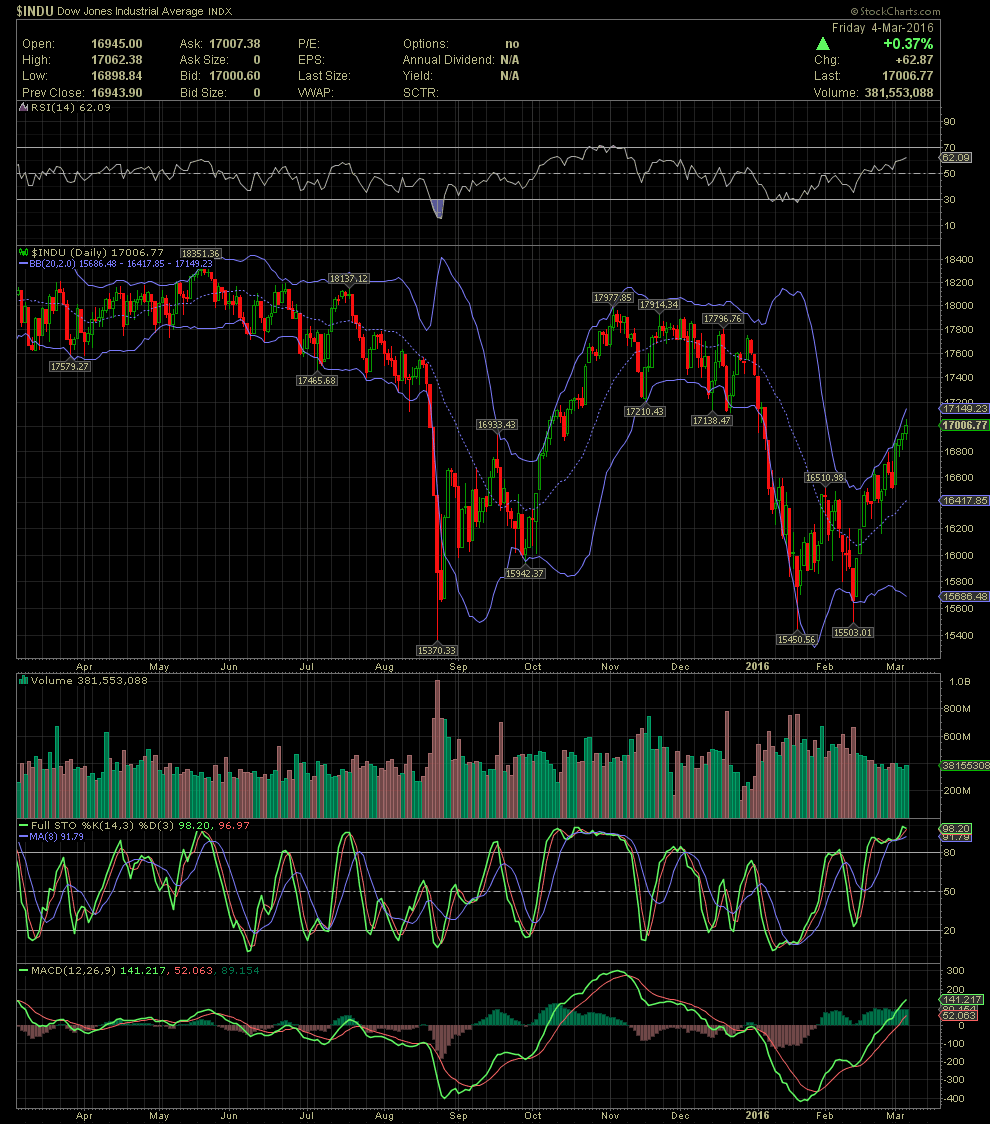
INDU Daily Chart ~ Basic Indicators
Here's a simple chart of the Dow Jones Average using only the RSI, FullSto, MACD and the Bollinger Bands (purple). Without the other indicators and moving averages, it shows an Index or stock trades within the Bollinger Bands.The dotted line between the outer bands is called the middle bollie. It is also the MA20. When a big board breaks above or below the middle bollie, there's an 85% probability that it will touch the upper or lower band. When it fails to break above or below that line, then the probability is high that a retest of the band where the stock came from will be retested. Note the failure of the INDU to break above the middle bollie in late July to late August. Note how many times on this one year chart that the Index touched the bottom bollie, trades up thru the middle bollie then runs into the upper bollie. The same occurs after the Index begins to fall from the upper bollie, breaks thru the middle bollie, and then trades into the lower bollie.
The longer term trading direction of the INDU can be better projected when incorporating the MACDs. When they trend downwards in a negative divergence, the Index or stock at best trades sideways but more oft then not, it declines. The same goes when the indicators are in a positive divergence, especially after a major selloff. Getting the picture of what I'm talking about? GTLA
 (1)
(1) (0)
(0)