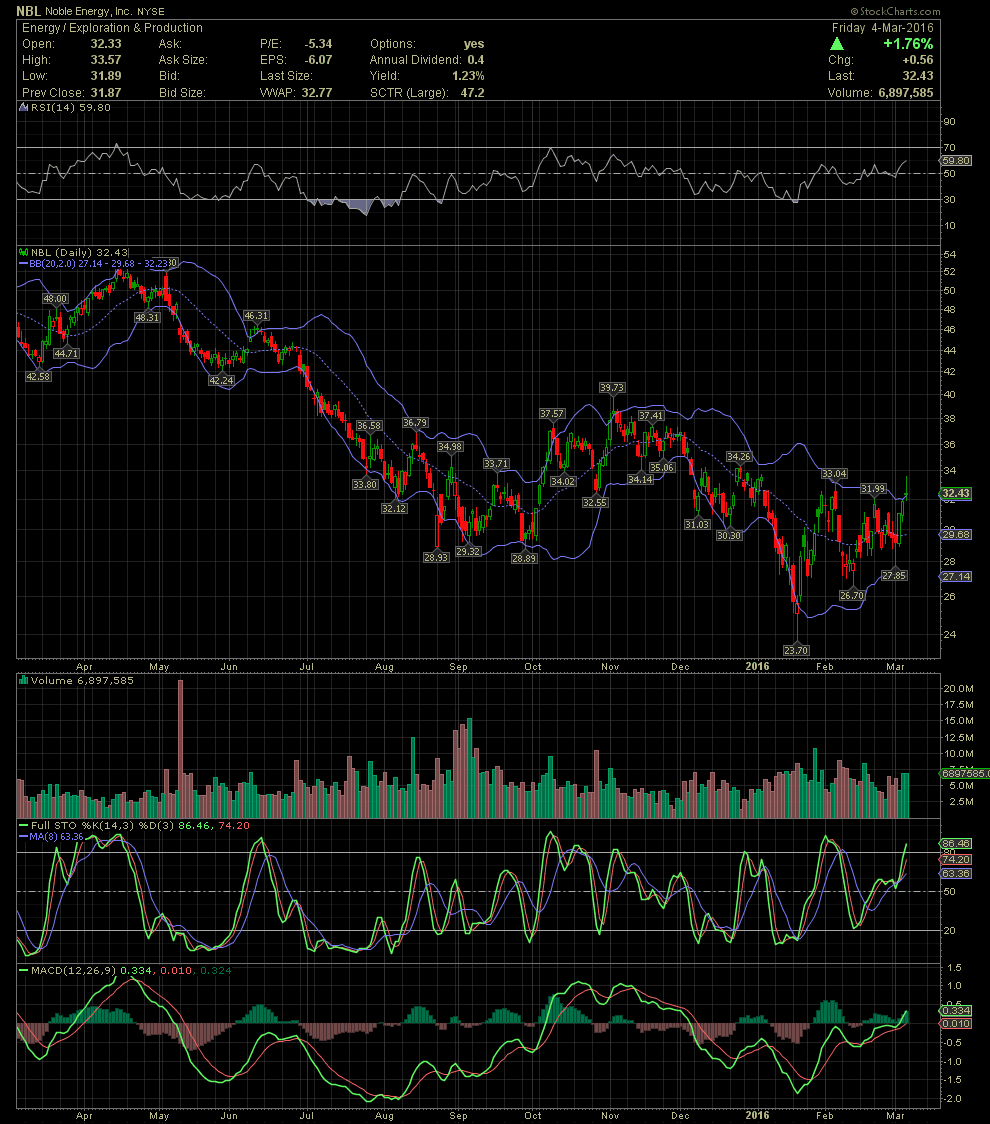
NBL Daily Chart ~ Easy to Swing Here's one of m
Post# of 2561

Here's one of many Big Board stocks that is easy to swing trade and also easy to use put and call options if one desires to step it up a notch or two. This chart is another example of who an investor can easily swing trade the trends by just using the bollie bands and the MACDs. From the lower bollie to the middle bollie, and if it breaks thru, then to the upper bollie. Once a stock begins to fall from the upper bollie, if it holds the middle bollie, then more than likely a revisit to the upper band. And the inverse is true. A rise from the lower bollie which fails at the middle bollie, then a trip back down to the lower bollie. Wash, rinse, repeat. Don't forget to take a look at the MACDs for confirmation of a reversal. Below is a one year chart. What I forgot to mention in my previous charts is that once I am in a trade, I then change my settings from a one year chart down to a six month period. It makes it easier to see the indicators in a less compressed format.

 (1)
(1) (0)
(0)