Gold Spot Price Index ~ Daily Chart I was rece
Post# of 2561
Posted On: 03/06/2016 12:34:46 AM

Gold Spot Price Index ~ Daily Chart
I was recently asked if the technical indicators I use are adaptable to futures and ETFs. The simple answer is, if it is chartable then yes. I primarily trade ETFs, stocks and options. I don't touch futures as I'm not smart enough but I did attempt them years ago. Like I said, I'm not smart enough for that, which for me is nothing more than gambling. I'll stick with slow and boring.
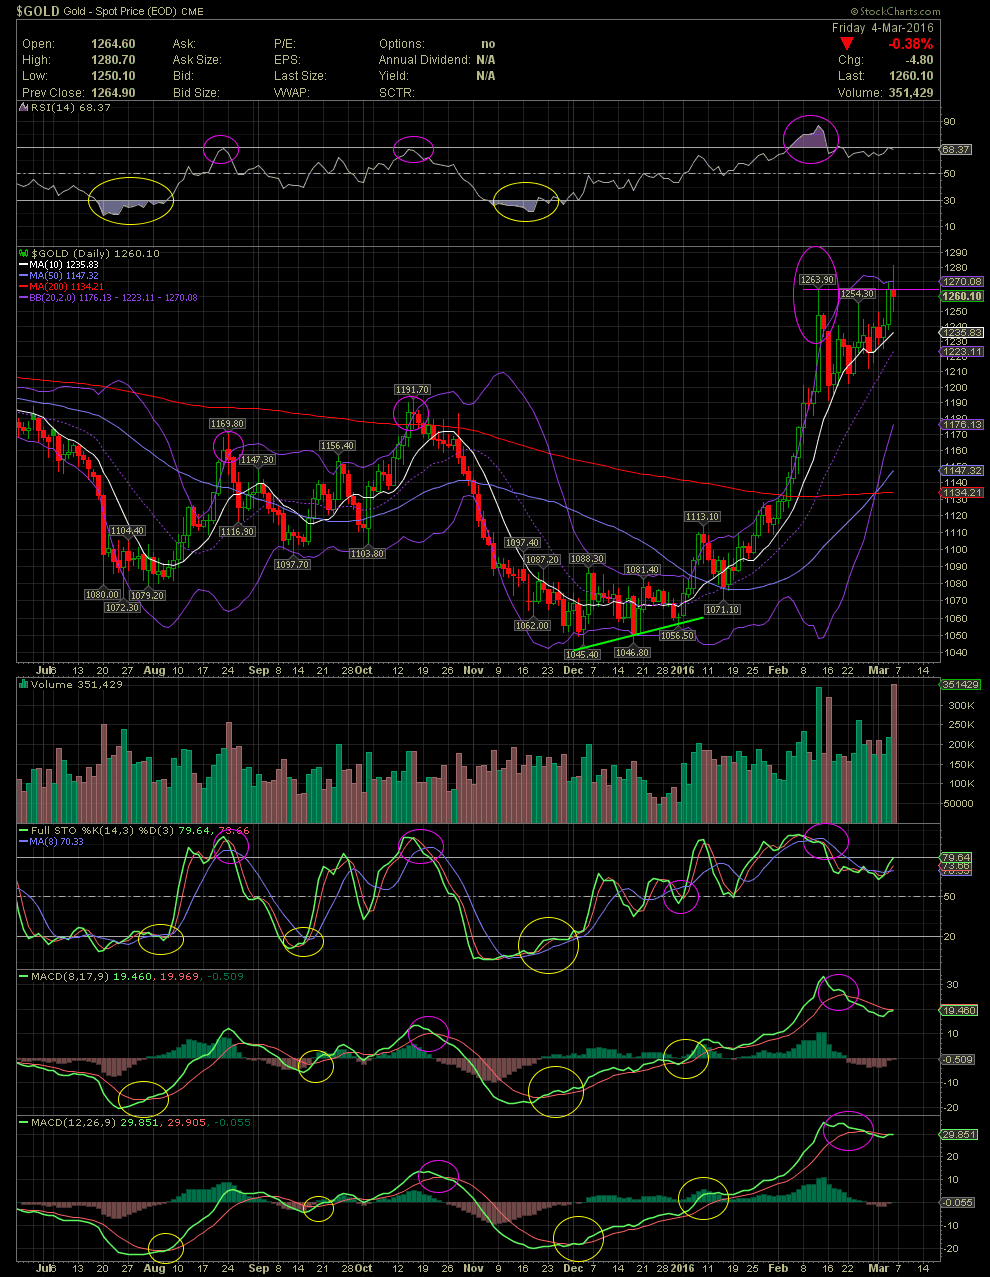
The chart below is one I use to gage the price of gold and I directly relate it to and overview of how a mining stock might move. It contains the same indicators and moving averages as with my previous S&P 500 chart. Please note the positions of the RSI, FullSto and MACDs when an uptrend or downtrend occurred with the actual price of gold. When the RSI was near or below its 30 line, along with the FullSto at or under its 20 line, along with the oversold levels of the MACDs, that was the entry time. When the RSI was at or above 70, the FullSto above its 80 line and the MACDs curling downward towards a negative crossover, it was time to take profits.
On this chart, one can also see how the Index couldn't stay above the MA200 (red) and collapsed after trying failing to close above it but for a day or two. At the same time, the Index was trading outside the upper bollinger band (purple line). That occurred in mid October. After falling under the MA50 (blue line) shortly thereafter, the Index began to establish a rounded bottom. When it broke back above the MA50 in early Jan, notice it retraced and tested the 50, held on that test, and then it was off to the races. During that bottoming formation, one saw higher lows being put in place. Note the positive crossovers of the MACDs prior to the move up.
A couple of days ago, the chart shows a formation known as the Golden Cross. That is when the MA50 crosses over the MA200. Many out there think that just awesome when that event occurs. Unfortunately, for those not all that familiar with technical work, the 50 and 200 day moving averages are slow indicators. On this chart, one can see how much of the move up one missed had they waited for the golden cross before entering a trade. Using the above mentioned indicators would have had an investor in weeks before and as low as $1,046 rather than waiting for the golden cross which executed near $1,230. The opposite of the golden cross would be the Death Cross, when the MA50 drops below the 200. Waiting for that to occur while also result in getting out at much lower prices than those that exit using the much more rapid indicators on the chart. In most all cases, the underlying stock has made a move long before these actual crosses occur.
Approx 3 weeks ago, the RSI entered the Nose Bleed Zone which calls for an overbought level of trading. How an Index or stock reacts after becoming overbought varies. You'll either see some sideways movement or a decline, sometimes gradual or sometimes very sharp. Since one never knows, the prudent thing to do is to protect profits by either taking some or all off the table. In the case below, the Index corrected a bit but traded in a bullish pennant formation before rising to the upside. You can also see the previous high at $1,263 gave pause for the last two days of trading. I am currently out of all but one mining stock due to the action of the last two weeks. GLTA
I was recently asked if the technical indicators I use are adaptable to futures and ETFs. The simple answer is, if it is chartable then yes. I primarily trade ETFs, stocks and options. I don't touch futures as I'm not smart enough but I did attempt them years ago. Like I said, I'm not smart enough for that, which for me is nothing more than gambling. I'll stick with slow and boring.
The chart below is one I use to gage the price of gold and I directly relate it to and overview of how a mining stock might move. It contains the same indicators and moving averages as with my previous S&P 500 chart. Please note the positions of the RSI, FullSto and MACDs when an uptrend or downtrend occurred with the actual price of gold. When the RSI was near or below its 30 line, along with the FullSto at or under its 20 line, along with the oversold levels of the MACDs, that was the entry time. When the RSI was at or above 70, the FullSto above its 80 line and the MACDs curling downward towards a negative crossover, it was time to take profits.
On this chart, one can also see how the Index couldn't stay above the MA200 (red) and collapsed after trying failing to close above it but for a day or two. At the same time, the Index was trading outside the upper bollinger band (purple line). That occurred in mid October. After falling under the MA50 (blue line) shortly thereafter, the Index began to establish a rounded bottom. When it broke back above the MA50 in early Jan, notice it retraced and tested the 50, held on that test, and then it was off to the races. During that bottoming formation, one saw higher lows being put in place. Note the positive crossovers of the MACDs prior to the move up.
A couple of days ago, the chart shows a formation known as the Golden Cross. That is when the MA50 crosses over the MA200. Many out there think that just awesome when that event occurs. Unfortunately, for those not all that familiar with technical work, the 50 and 200 day moving averages are slow indicators. On this chart, one can see how much of the move up one missed had they waited for the golden cross before entering a trade. Using the above mentioned indicators would have had an investor in weeks before and as low as $1,046 rather than waiting for the golden cross which executed near $1,230. The opposite of the golden cross would be the Death Cross, when the MA50 drops below the 200. Waiting for that to occur while also result in getting out at much lower prices than those that exit using the much more rapid indicators on the chart. In most all cases, the underlying stock has made a move long before these actual crosses occur.
Approx 3 weeks ago, the RSI entered the Nose Bleed Zone which calls for an overbought level of trading. How an Index or stock reacts after becoming overbought varies. You'll either see some sideways movement or a decline, sometimes gradual or sometimes very sharp. Since one never knows, the prudent thing to do is to protect profits by either taking some or all off the table. In the case below, the Index corrected a bit but traded in a bullish pennant formation before rising to the upside. You can also see the previous high at $1,263 gave pause for the last two days of trading. I am currently out of all but one mining stock due to the action of the last two weeks. GLTA
 (1)
(1) (0)
(0)