SPX Daily Chart ~ This Chart Is Loaded With Techni
Post# of 2561

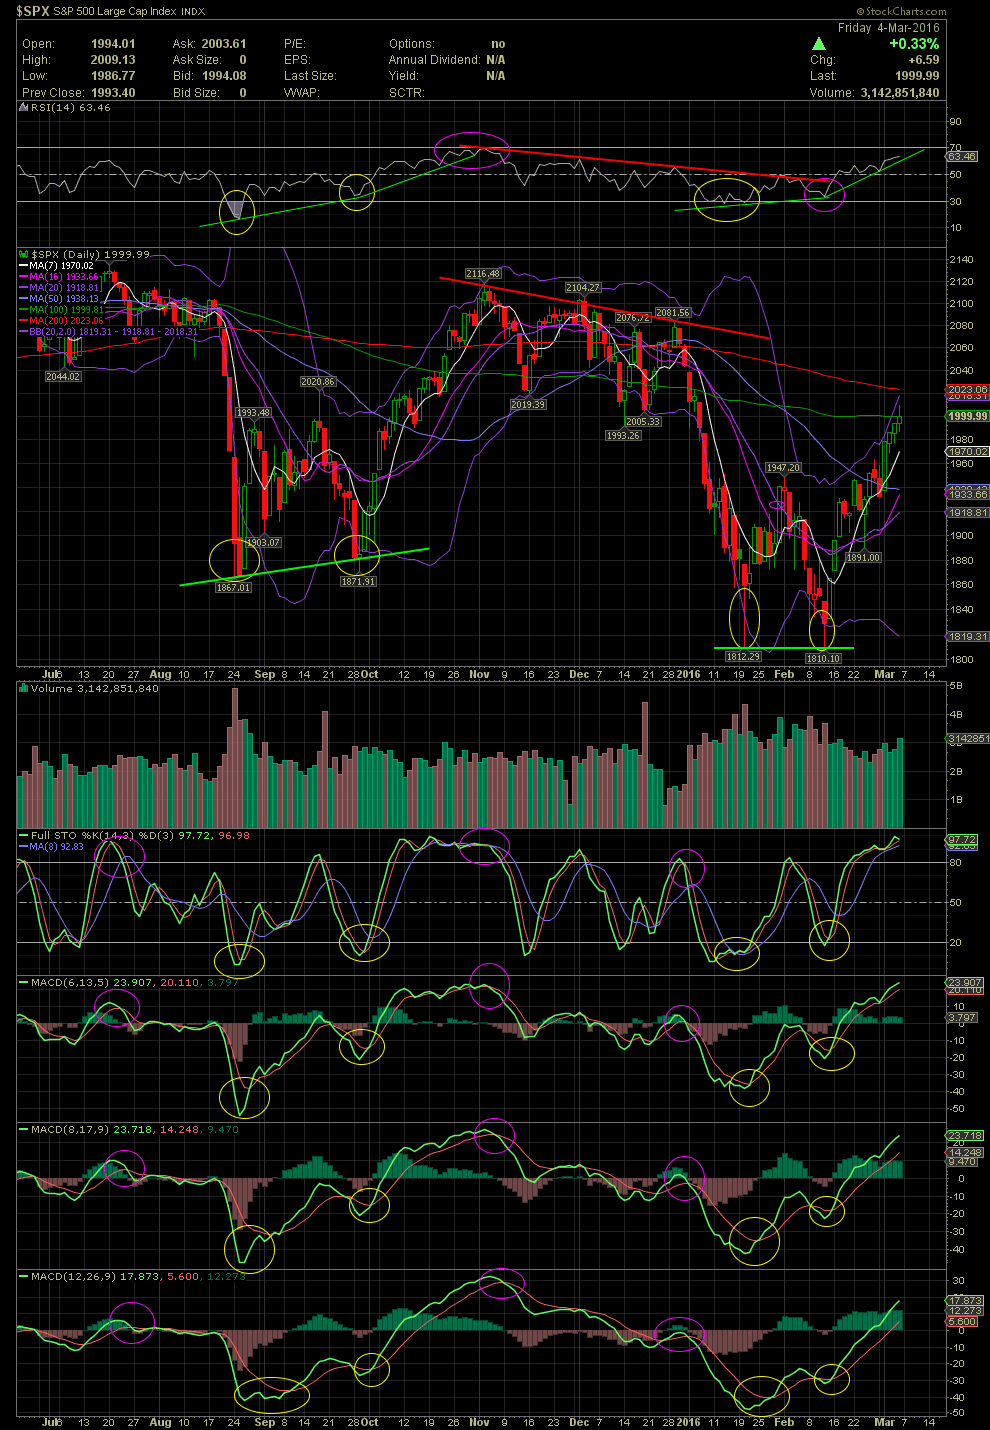
If your are new to charts and technical indicators, the following chart is heavy with various timing signals based solely on the technical indicators. It is the standard 9 month period which most charting services offer. As I have mentioned numerous times in the past, I look at many other, longer term indicators, but there are enough here with just the FullSto, MACDs, RSI, Bollinger Bands and the various moving averages that can help anyone substantially increase their returns based solely on technicals without fundamentals. This would be more so with the case of big board issues rather than with the OTC. If you are investing in the OTC, you'd better be damn good with the fundamentals because most are simply story stocks led by lying scum, others by inept and non qualified management teams, others nothing more than pump and dump criminals, and share selling scams. Within the OTC are are a few that truly are gems yet few and far between. This is where technicals come into play.
Below is the Daily Chart of the S&P 500. I've drawn lines and circles all over this chart, so allow me to walk you through things, one step at a time. The negative crossovers of the FullSto and MACDs are circled in pink. The positive crossovers of the same indicators are circled in yellow. All rising trend lines are in green while declining lines are red. On the chart itself I've circled the candles being outside the lower bollies in yellow circles.
Prior to the decline of the market in mid August, a few caution signs were already being seen in mid July. The RSI began to gradually weaken. The FullSto at the same time of mid July was in very overbought territory. The MACDs were just above their zero lines before flat lining coming into the end of July. I don't know what the news was in mid August to cause the selloff, but it doesn't matter as technicians were already beginning to see evidence of a weaker market or the potential of a decline. Another indication of possible trouble was the fact that the S&P wasn't able to trade and hold above the MA20 and only able to hover on it. On Aug 18 and 19, the FullSto and MACDs initiated a crossover to the downside as the market began to drip. Again, those same indicators were unable to reach higher highs since July 17. The selloff was quick and deep and on heavy volume. That heavy volume in hindsight can be caulked up as capitulation, which is indicative of most bottoms as investors panic into the selling. But if one had been following the indicators, you would more than likely not have been in the big boards or at least reduced your exposure somewhat with the weakening indicators beginning in mid July.
Finding the bottom during a decline is not that difficult, yet many investors choose to try catching a falling knife. If one were to follow the indicators while waiting for a calculated entry based on technicals, one would have been able to sidestep most of the decline. By Aug 25, the RSI, FullSto and MACDs were very oversold and deep into the basement levels. Please notice the positioning of the candles very much outside the lower bollie band.
The subsequent rally from oversold areas, ran to a point where the FullSto entered slightly overbought levels, while the MACD signal lines didn't move above their zero lines. The market reversed once again and dropped outside the lower bollies again. What one would be looking for is a leveling out or a turn back up again with the same indicators that forewarned the initial decline. More importantly, look at the higher lows put in by the RSI and the MACDs, and more importantly the higher lows of the actual S&P Index.
The Index then rallied for approx one month. Once a couple of the indicators began to reach their overbought zones, the RSI at 70 and the FullSto above 80, the Index ran into the exact same levels where it was back in mid July. A lot of profit taking and/or breakeven selling occurred. This was in early November. What is important from that point forward into the step decline of the market in early January is the gradual decline in the RSI, the FullSto and MACDs. Also note the formation of a declining tops line (red line) which obviously represents ongoing weakness. Had one paid attention to the lower highs in the RSI, FullSto, MACDs and the weaker prices on the chart, the subsequent drop in January should not have come as a surprise. The move back up in prices after a double bottom was established in mid Feb, should also have been anticipated by those who noticed the higher lows of the indicators. Although the market at this point was priced the same as in mid Jan, the same indicators discussed above were already on the rise suggesting higher prices ahead.
Charts and technicals are not guarantees but they are great tools to help one with decisions prior to possible moves in either direction. Patience and discipline are needed. Try not to catch the falling knife as it may slice you. Don't chase a stock, especially on the OTC, if all the indicators are in the overbought territories. You'll read and hear this from me over and over and over. If you follow the technicals, there will be those very few instances when a stock does something different than the normal historical patterns. Over time, you will see the results of your hard work. You might miss a trade, but there will be another train that comes by shortly. GLTA

 (1)
(1) (0)
(0)