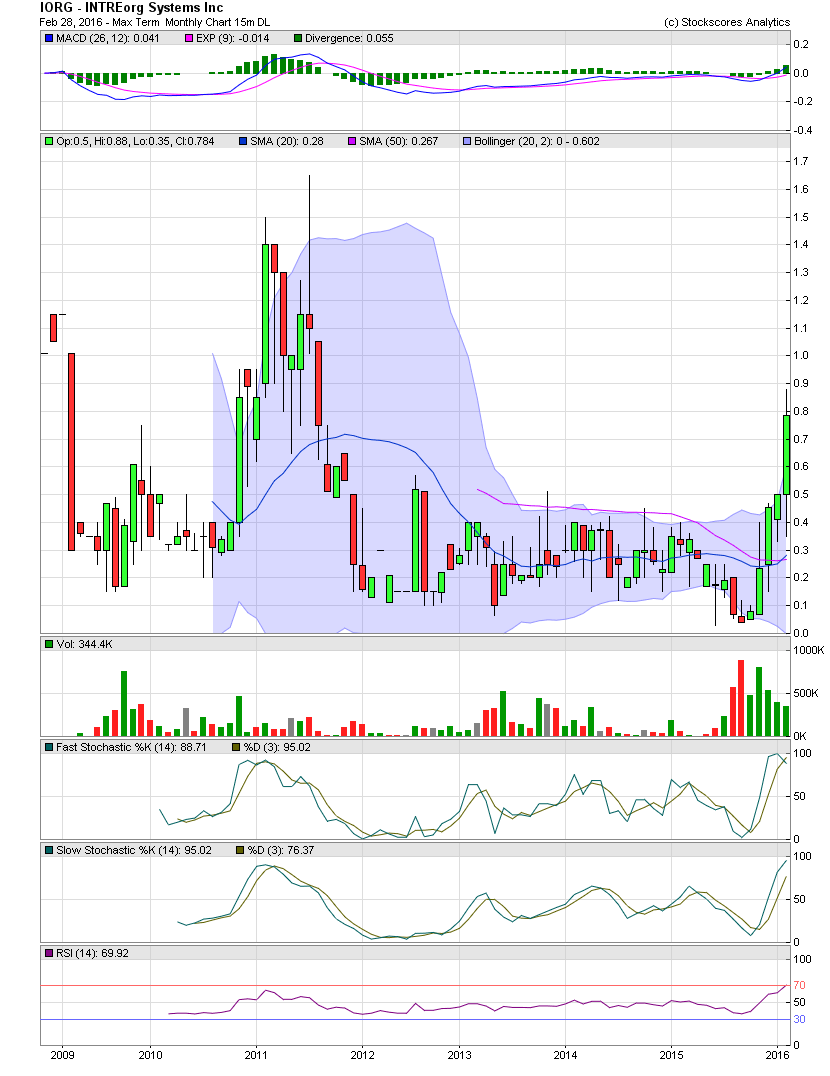
IORG Monthly Chart ~ Highest Trading Levels Since
Post# of 2561

This chart is a monthly chart so that members can see that the stock is trading at its highest level since July 2011. Should the volume continue and the stock appreciate and close at or just above $1.00, to move to all time highs shouldn't be hindered with any sellers who may be breaking even from holding the security back in the days when the stock traded up to $1.65 in June 2011. The volume trading at that time is being eclipsed with the recent volume of the last seven months. GLTA

 (0)
(0) (0)
(0)