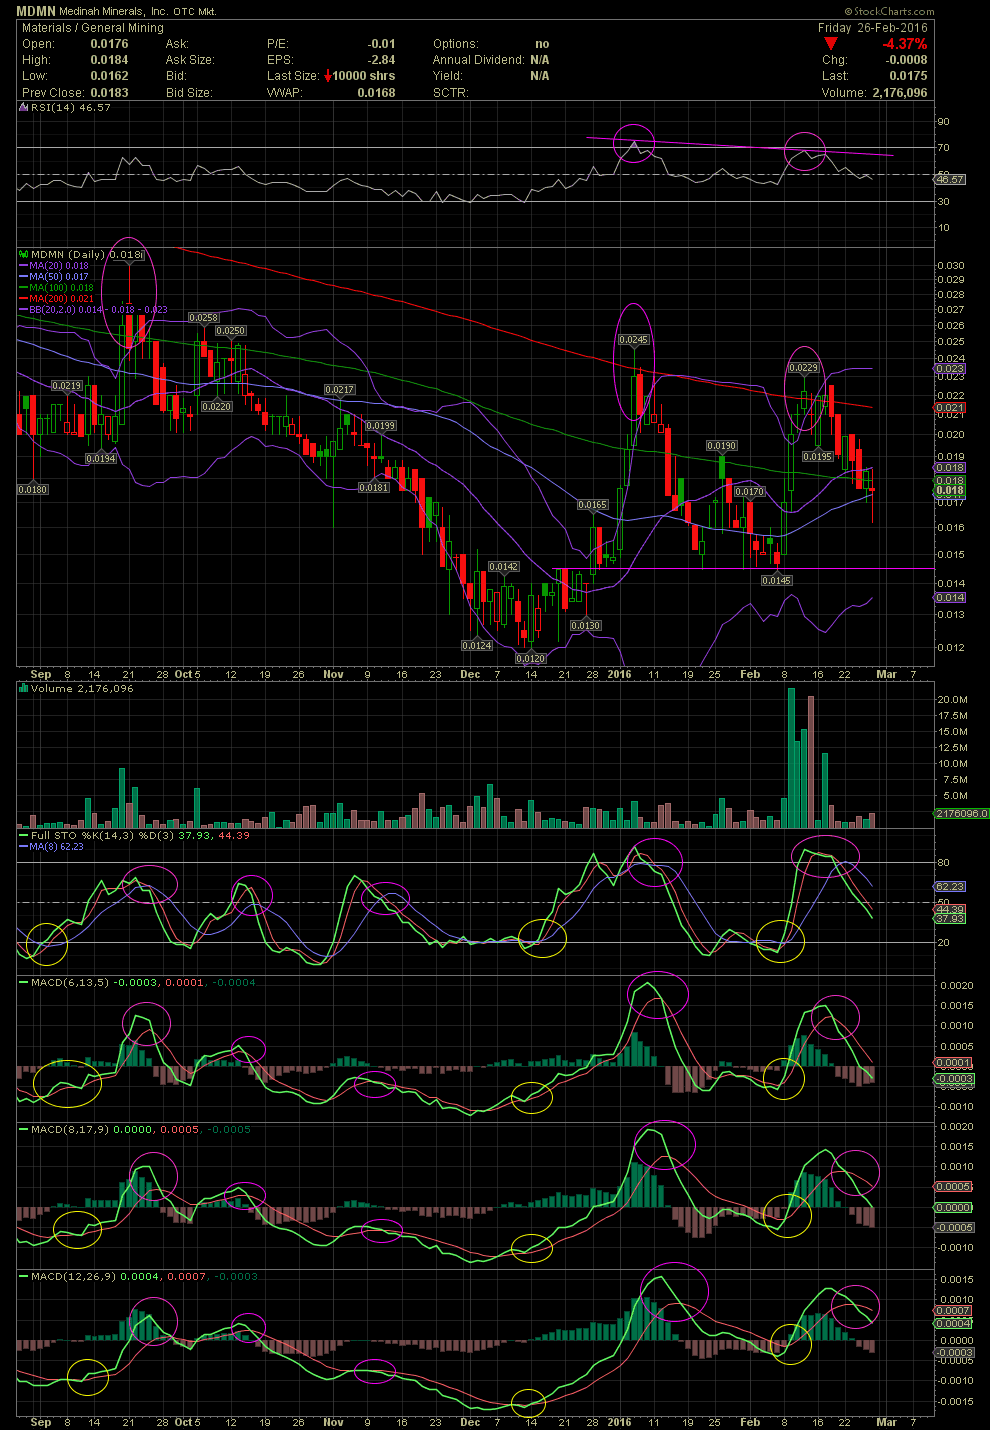
MDMN Daily Chart ~ The Correction Continues Lin
Post# of 2561

Link back to my MDMN post of Feb 21 for brief thoughts of the technicals after our latest exit of the swing trade near the highs of .023 after entries just 4-7 days prior at or near .0145. The downtrend continues after the FullSto and MACDs confirmed the sell signal given when the stock traded outside the upper bollies on two consecutive days. So far, the initial support level of the MA50 has held for closing prices although the share price did penetrate the moving average twice. Should that support level not hold and close below it, then a retest of the support line at .0145 could be seen over the next 1-2 weeks. Time will tell. Until the chart and technicals have reset, we will wait for yet another calculated entry. The 12d MACD just crossed into a negative divergence on Thursday. Without major material news, I expect to see lower prices. GLTA

 (0)
(0) (0)
(0)