IORG Daily Chart ~ Continuation to the Upside Unde
Post# of 2561
Posted On: 02/21/2016 1:43:05 PM

IORG Daily Chart ~ Continuation to the Upside Underway
First of all, on a fundamental basis only, if you haven't yet reviewed the IORG website, get to work:
http://intreorg.com
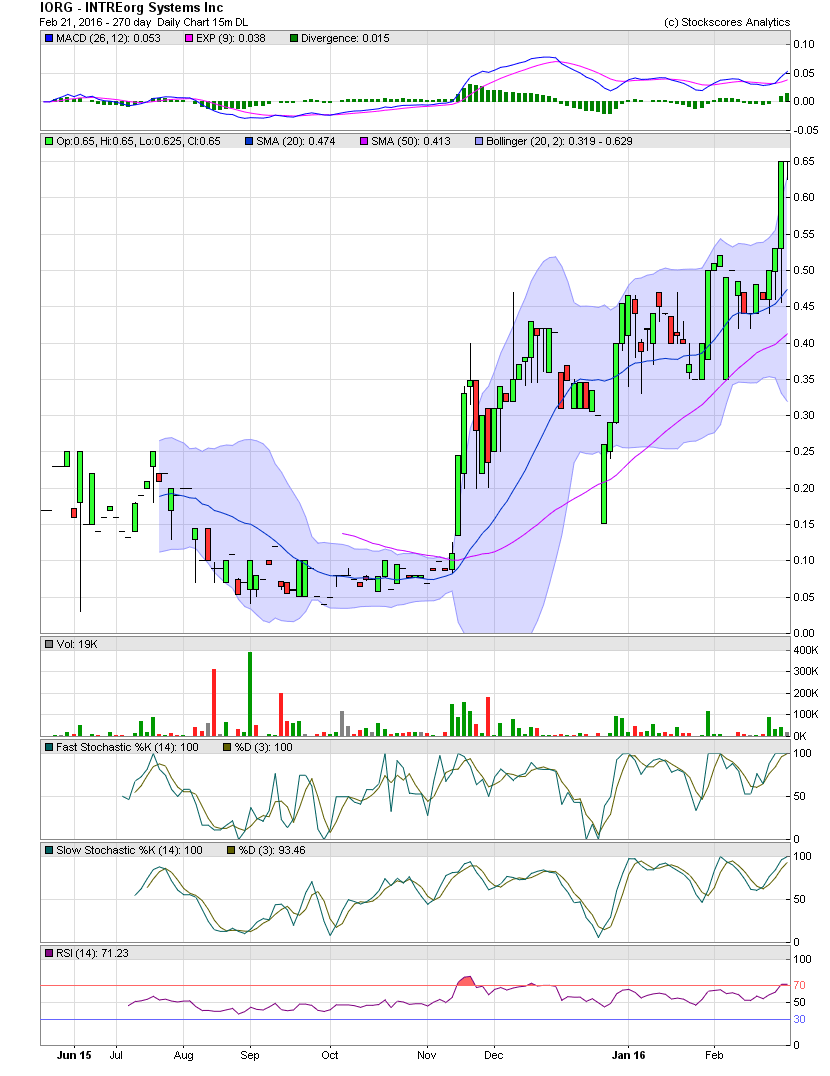
On a technical basis, IORG is trading beautifully. Last week, the stock price finished at .50. For the week, the stock was up approx 30%. I initially shared IORG when it was quoted .08 x .15 in early to mid November. There was very little to be had at those levels, though. The stock has since appreciated to the closing high of .65 set on Thursday and again on Friday. While the candles traded outside the upper bollie into Thursday's close, the bollie was at .57. Friday's trading saw some sideways movement from .625 to .65, while the bollie band appreciated to .629. So, although the Friday's candle was trading outside the upper bollie, it's only by a small amount. If it were .05-.10 outside the bands, that would cause some short term, trading concern for me. This issue, though, lies in if one were to sell 25k-50k+, can one re-enter with that size on any pullback? Hard to say. But with a float around 5.4MM and only trading approx 25,000 per day over the last three months, it would be a risky endeavor in my opinion. Keep in mind, the average trading volume has primarily been on the upside. It would suck if one were to sell any size while those accumulating absorbed one's shares, leaving even a tighter held float than it already is. GLTA
First of all, on a fundamental basis only, if you haven't yet reviewed the IORG website, get to work:
http://intreorg.com
On a technical basis, IORG is trading beautifully. Last week, the stock price finished at .50. For the week, the stock was up approx 30%. I initially shared IORG when it was quoted .08 x .15 in early to mid November. There was very little to be had at those levels, though. The stock has since appreciated to the closing high of .65 set on Thursday and again on Friday. While the candles traded outside the upper bollie into Thursday's close, the bollie was at .57. Friday's trading saw some sideways movement from .625 to .65, while the bollie band appreciated to .629. So, although the Friday's candle was trading outside the upper bollie, it's only by a small amount. If it were .05-.10 outside the bands, that would cause some short term, trading concern for me. This issue, though, lies in if one were to sell 25k-50k+, can one re-enter with that size on any pullback? Hard to say. But with a float around 5.4MM and only trading approx 25,000 per day over the last three months, it would be a risky endeavor in my opinion. Keep in mind, the average trading volume has primarily been on the upside. It would suck if one were to sell any size while those accumulating absorbed one's shares, leaving even a tighter held float than it already is. GLTA
 (0)
(0) (0)
(0)