RXMD Daily Chart ~ A Solid Week But Getting Overbo
Post# of 2561
Posted On: 02/21/2016 1:18:57 PM

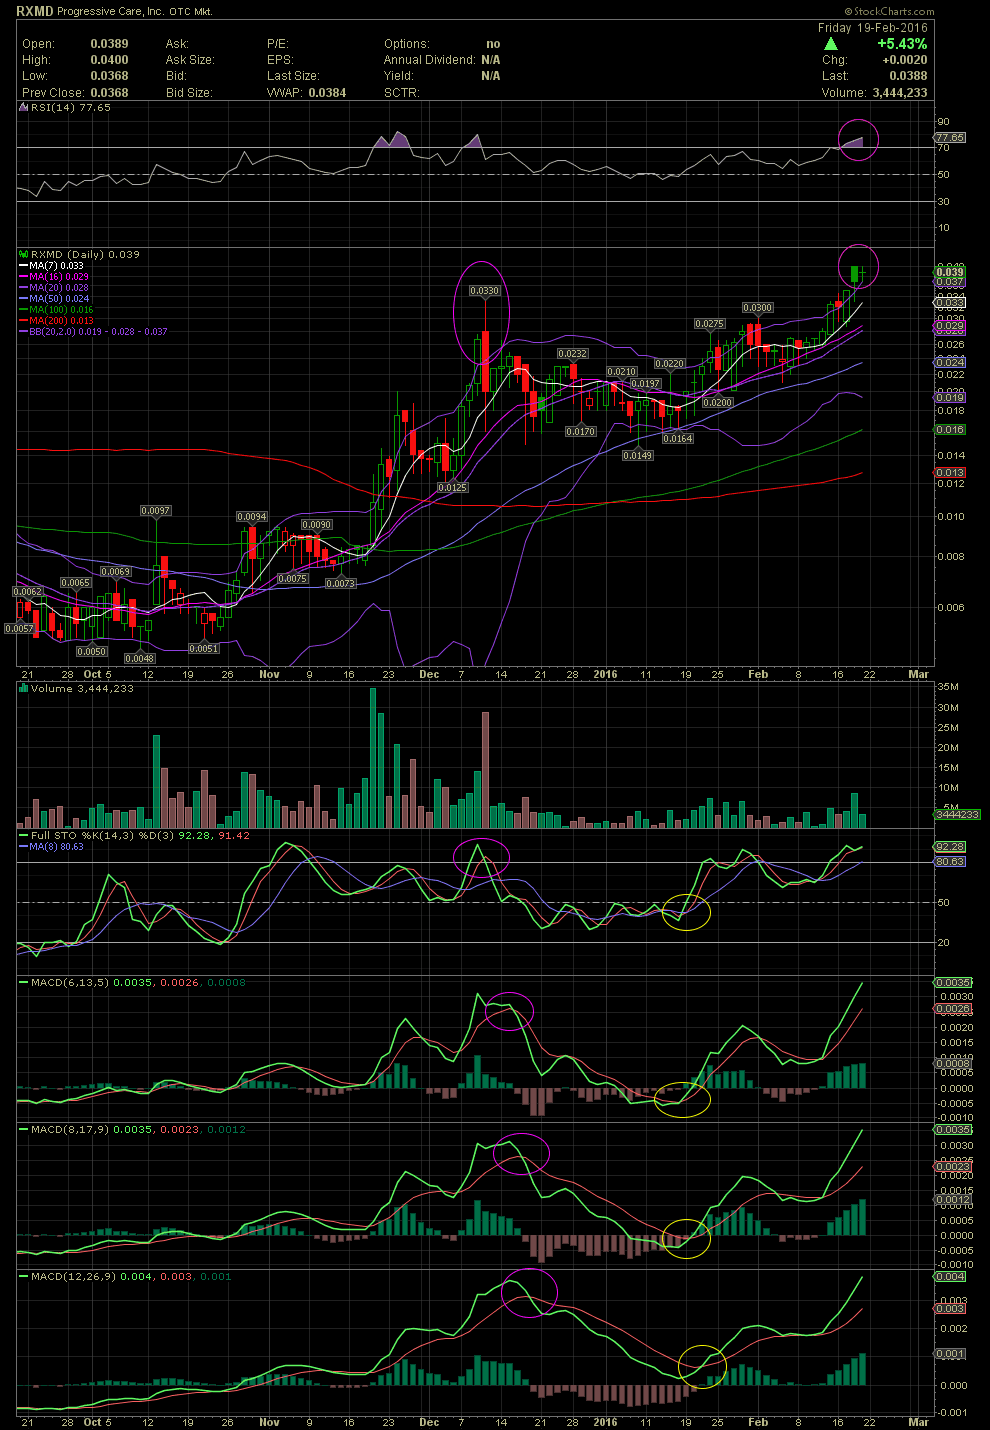
RXMD Daily Chart ~ A Solid Week But Getting Overbought
RXMD was up almost 20% for the week from its previous close while trading from a low of .0287 to an intra-week high of .04. Short term, the chart and technicals are beginning to show signs of becoming a bit overbought. The RSI is in the nosebleed zone. Remember, many will call that the 'Power Zone', quite laughable, but true. Show me a penny stock that trades for a lengthy period while in the nosebleed levels of the RSI at 70+. The FullSto is also in overbought territory as can be seen below. The MACDs haven't started topping and curling yet, but they are also getting to lofty levels. Additionally, the last two trading days saw both candles almost completely outside the upper bollie band. There will be a re-enter of the price to within the bollie bands. The only question is how the stock will trade. Sideways consolidation, a minor pullback or a share decline? No one knows. If one is invested for the long run and not concerned about a correction, then all is good, especially if looking to accumulate more. I'll probably post a RXMD chart next weekend. GLTA
RXMD was up almost 20% for the week from its previous close while trading from a low of .0287 to an intra-week high of .04. Short term, the chart and technicals are beginning to show signs of becoming a bit overbought. The RSI is in the nosebleed zone. Remember, many will call that the 'Power Zone', quite laughable, but true. Show me a penny stock that trades for a lengthy period while in the nosebleed levels of the RSI at 70+. The FullSto is also in overbought territory as can be seen below. The MACDs haven't started topping and curling yet, but they are also getting to lofty levels. Additionally, the last two trading days saw both candles almost completely outside the upper bollie band. There will be a re-enter of the price to within the bollie bands. The only question is how the stock will trade. Sideways consolidation, a minor pullback or a share decline? No one knows. If one is invested for the long run and not concerned about a correction, then all is good, especially if looking to accumulate more. I'll probably post a RXMD chart next weekend. GLTA
 (1)
(1) (0)
(0)