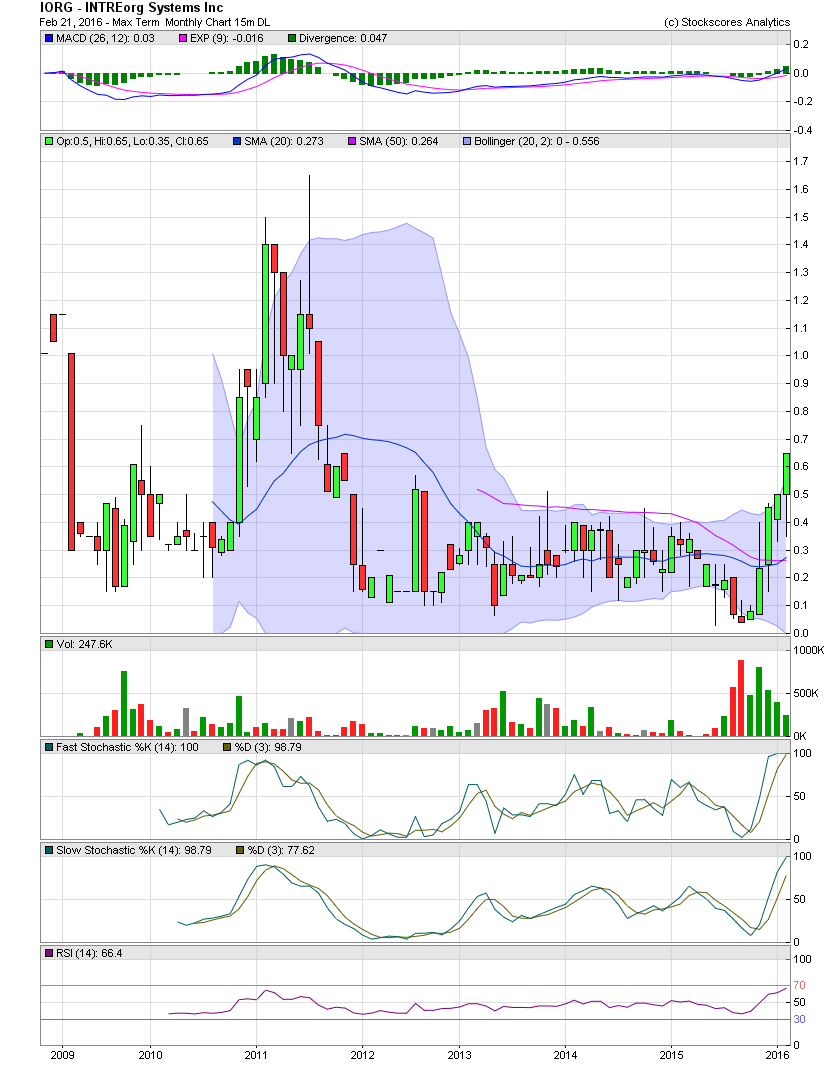
IORG Monthly Chart ~ New Highs Not Seen Since 2011
Post# of 2561

The chart below is a Monthly Chart of IORG. As you can see, Friday's close of .65 was the highest since the last quarter of 2011. It won't take much more to see the stock appreciate to $1.00+. The volume of 2011 that saw the decline from $1.40-$1.65 wasn't substantial. Additionally, I would guess that most who were in IORG in 2010/2011 have probably moved on. So should the stock continue moving towards those levels above $1.00, I would not expect too much resistance from individuals selling when they have finally come to a breakeven position. I'm looking forward to financials, news, and more upside. Fingers crossed!

 (0)
(0) (0)
(0)