MDMN Daily Chart ~ Beginning a Reset After Our Exi
Post# of 2561

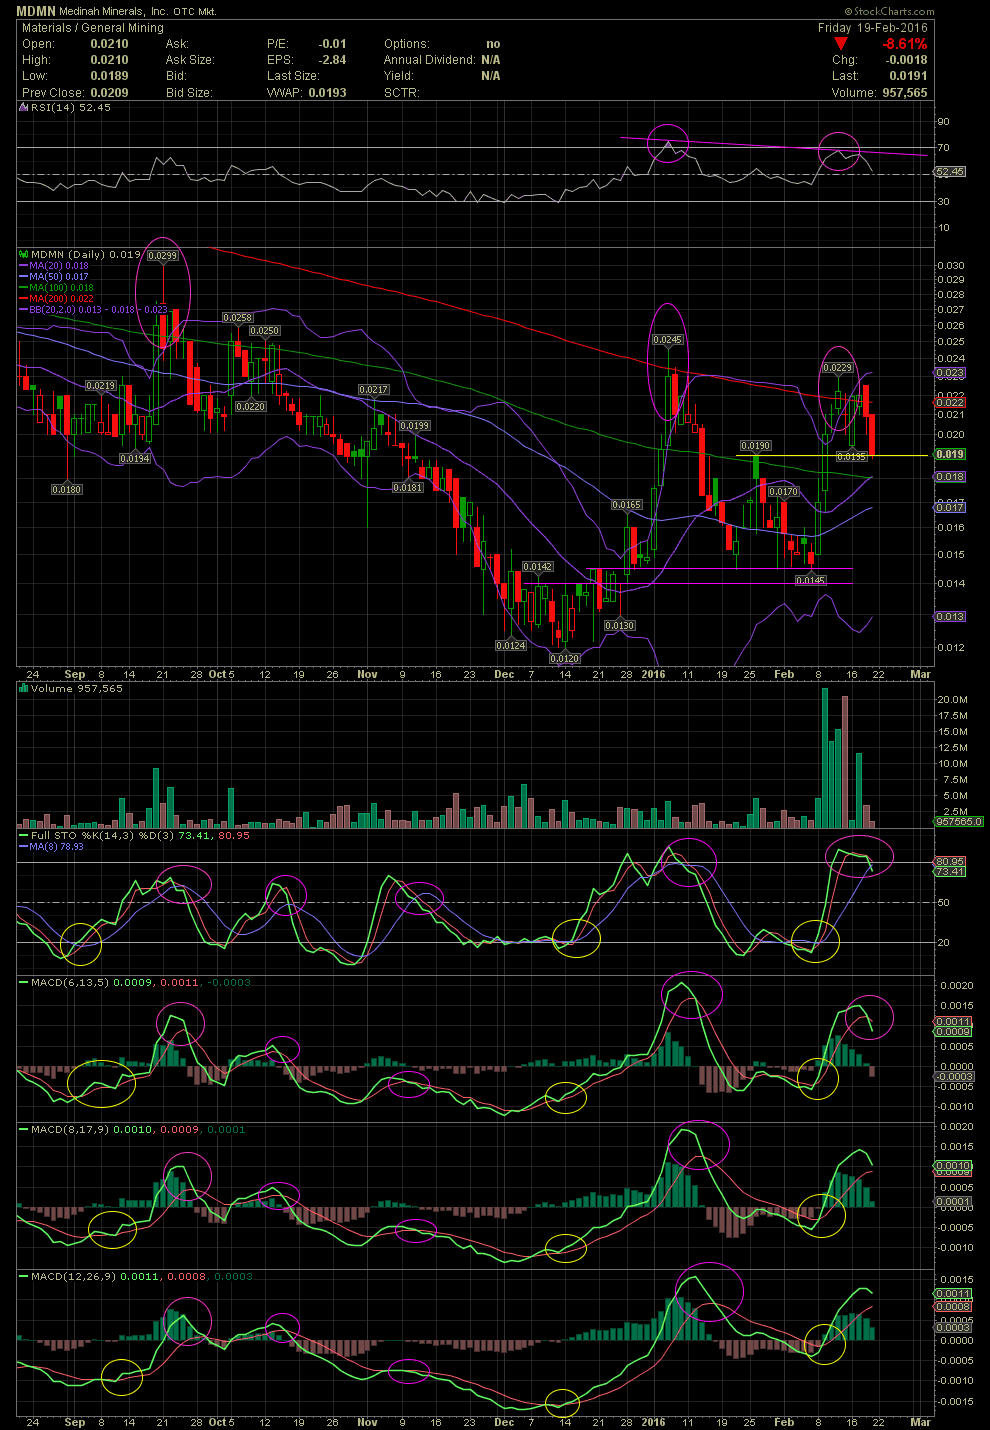
Please link back to my previous comments on MDMN and why a few of us exited the stock near as high as .0225. Nothing has changed since my last MDMN chart post. A couple of friends asked if I felt that the .019 previous top would offer any support for trader during this consolidation or decline. I added a horizontal support line at .019, and you can see it in drawn in yellow. I don't see a lot of support there because the stock opened on Jan 26 on a weak buy at .019, while the rest of the day saw selling. MDMN then dropped further until the technicals reset and offered a calculated entry. The subsequent rally took the share price completely outside upper bollie, which was the third such occurrence, and we all know what happens then. What's outside the bollie always returns within the bands. If one were trading using just the bollie bands, one would have had three very successful swing trades just on this 6 month chart.
Currently, the FullSto and first of the three MACDs have started to rollover with a negative crossover. Although I missed the last trade due to not having available trading funds, due to my decision of accumulating more IORG in the .30s and .40s and happy to see it closed Friday at .65 for a new 4.5 year high. While a few friends took advantage of the MDMN chart setup less than two weeks ago and sold for a 40-60% over that short swing, now we wait for yet another reset. GLTA

 (0)
(0) (0)
(0)