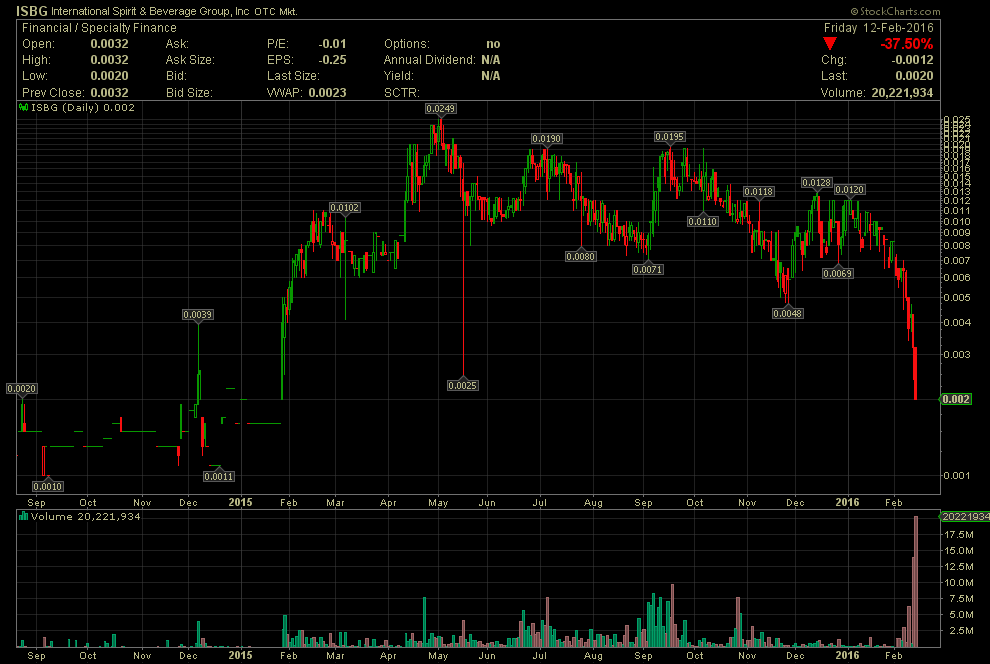
ISBG 18 Month Daily Chart ~ Nearing Levels of Earl
Post# of 2561

As one can see on the chart below, ISBG broke out in February 2015 at the .002 level, which is where the stock is now. Can it trade lower I was asked this morning? Of course it can. Huge selling volume over the last week. Again, my guess only is that conversions or certificates are being liquidated aggressively. I hope it doesn't last much longer.

 (0)
(0) (0)
(0)