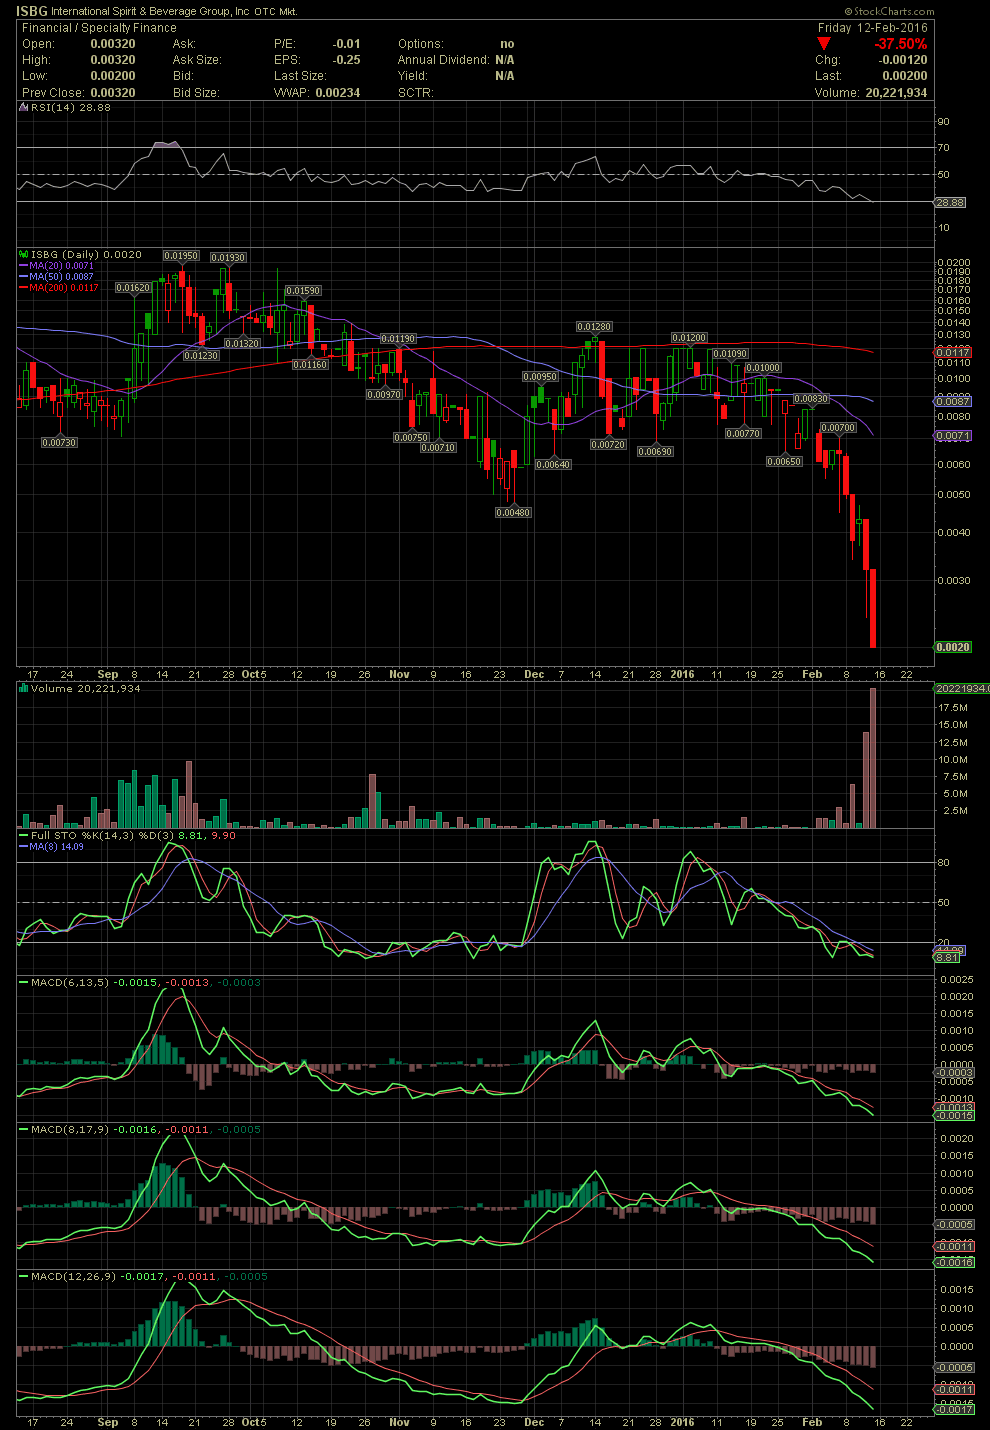
ISBG Daily Chart ~ A Huge Decline Underway Afte
Post# of 2561

After failed attempts to get back above the MA200, ISBG collapsed under previous support levels in the .006s. The FullSto and MACDs began their negative crossovers from lower levels that are typical with large declines. Congrats to those that traded out before the steep drop. It's more than clear by just looking at the volumes sticks that there has to be a conversion or two underway. Old certificates out there, convertible notes converting into stock and now being sold, or whatever the reason might be is unknown to me. But the chart somewhat forecast some weakness was on the horizon. Again, how far or severe a drop might be is not known in advance. No the question for those interesting or invested in ISBG would be where might some support be seen? Since the stock is now trading at lows not seen in over one year, a look at a longer term chart would be the obvious answer. I'll post a 2 year chart next, and one can see where the stock was trading at prior to the move which began in Feb 2015 from these levels. As one can see on the chart below, the indicators are in full decline and well into very oversold levels. More than likely, I'll be adding as early as tomorrow. Attempting to catch the falling knife, lol? You bet. Smart move, no. But when the expected conversion is completed, I believe the stock price will rally back quickly. Sometimes it pays to get a head start. But sometimes that falling knife will slice you to pieces. GLTA, especially those re-entering or adding with me.

 (0)
(0) (0)
(0)