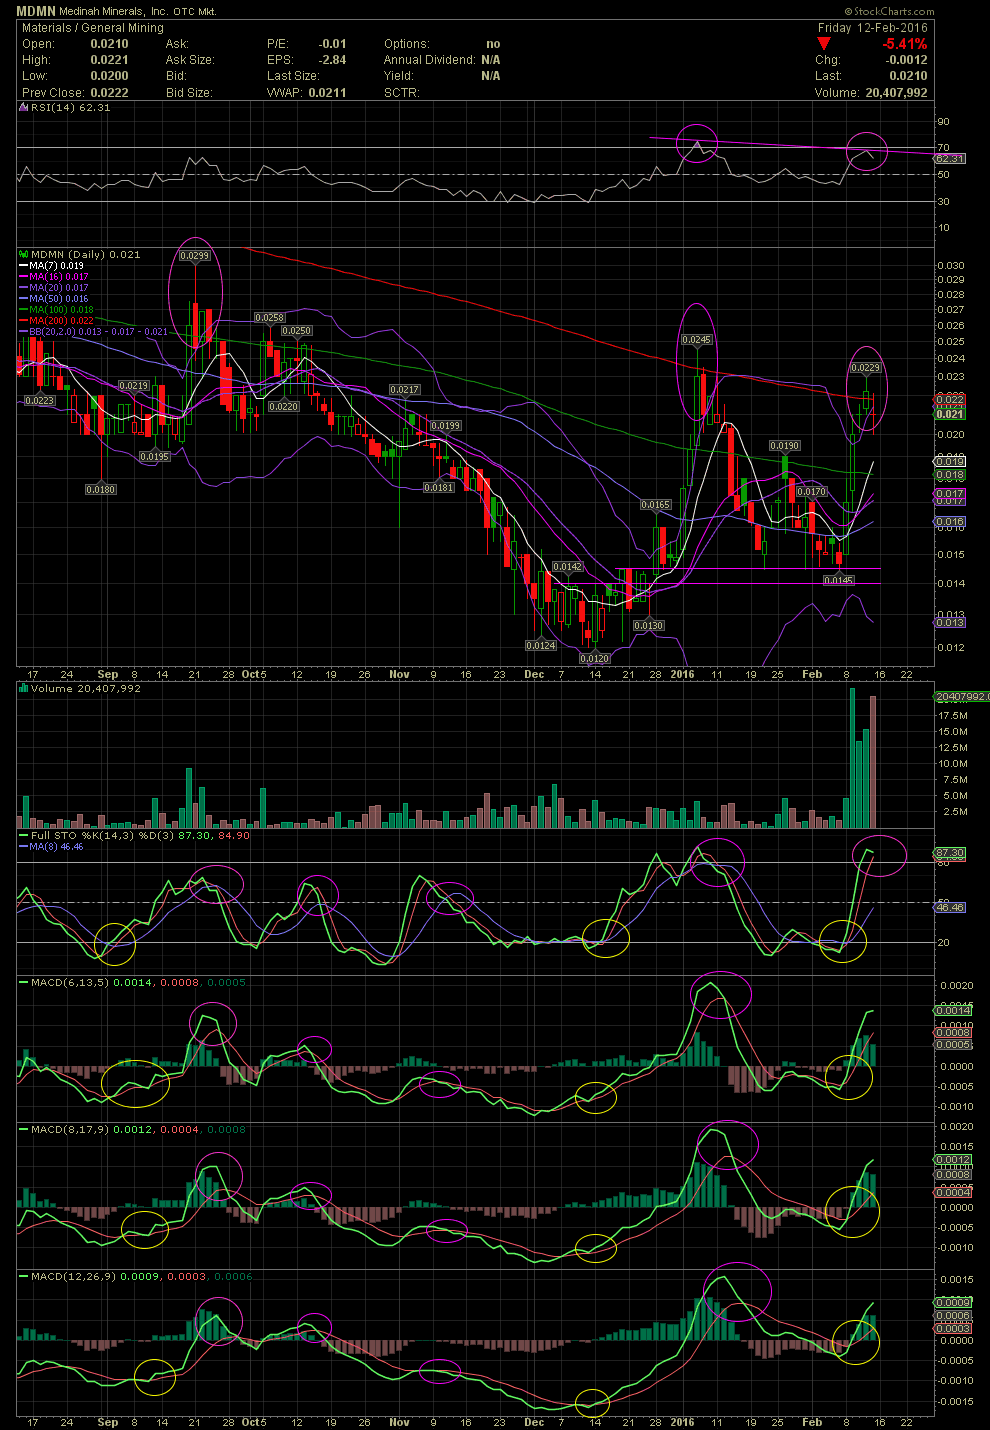
MDMN Daily Chart ~ Another Great Swing Trade for T
Post# of 2561

I have shared the technicals and charts on MDMN for some time now. Congrats to those of you that followed the indicators yet again for another successful swing trade from the support lines at .014/.0145 to the recent move outside the upper bollie and into the MA200. I didn't play the last entry, but I do know 11 individuals who did well with gains from 30% to as much as 53% for a friend over a 7 day period. Currently there are a ton of rumors regarding the large buyer who appeared this week and bid the stock up this week seeing volume of 75.27MM shares, not seen since late 2010/early 2011. Is something finally underway with MDMN, or just the continuous 20 year tale of massive riches? I have zero clue. Great fundamental news will move the stock higher, or a buying continuation of the large investor. Without news, the chart and technicals are suggesting a rest is in order. Will we see a decline or simply consolidation? No idea either, lol. We'll have to let the chart talk to us. Currently, the RSI established a lower high than the previous run. The FullSto is in slightly overbought levels, yet the MACDs have plenty of room to move higher. A development to watch would be if the stock can close above the MA200, which hasn't been seen since October, 2014. That would be a technical indication that MDMN is going to move higher. GLTA

 (0)
(0) (0)
(0)