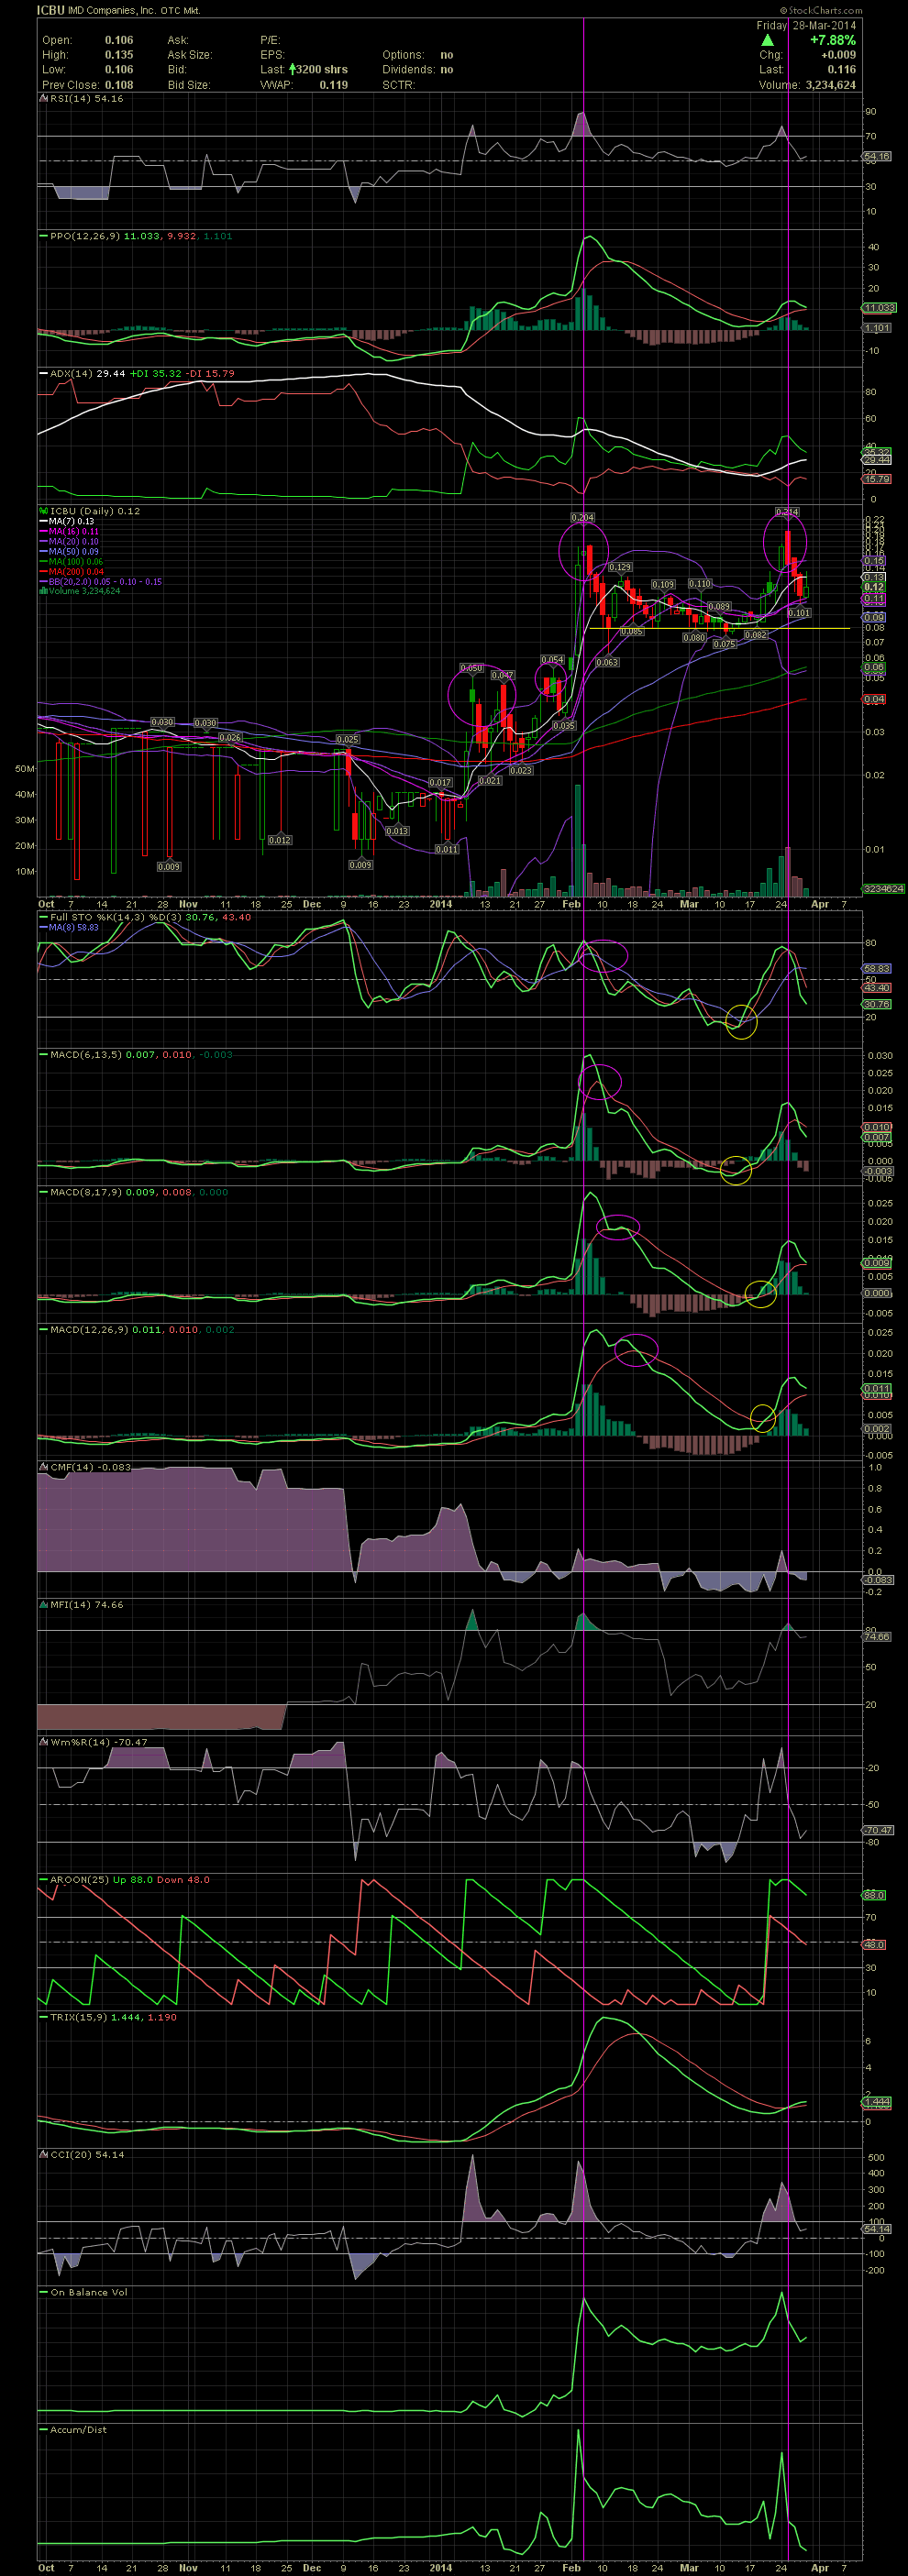
ICBU Daily Chart ~ Another Successful Swing Trade
Post# of 2561
A number of friends played ICBU to the tee again last week. I believe Kings was one such swing trader who banked again with ICBU. One an easily see the two spikes outside the upper bollies. What I also annotated with vertical lines (pink) was the time periods prior to the negative or curling of the FullSto and MACDs. ICBU say a decline of 60% in early Feb after the move outside the bollie and an almost 50% decline after the violation of the upper bollie last week. It works almost every time. There are rumors of big news this coming week, and that could turn the indicators north again. Since I don't know much about the fundamentals, I can only follow the momentum on the charts. The .11 area did show some support on Thurs and Fri. GLTA

 (0)
(0) (0)
(0)