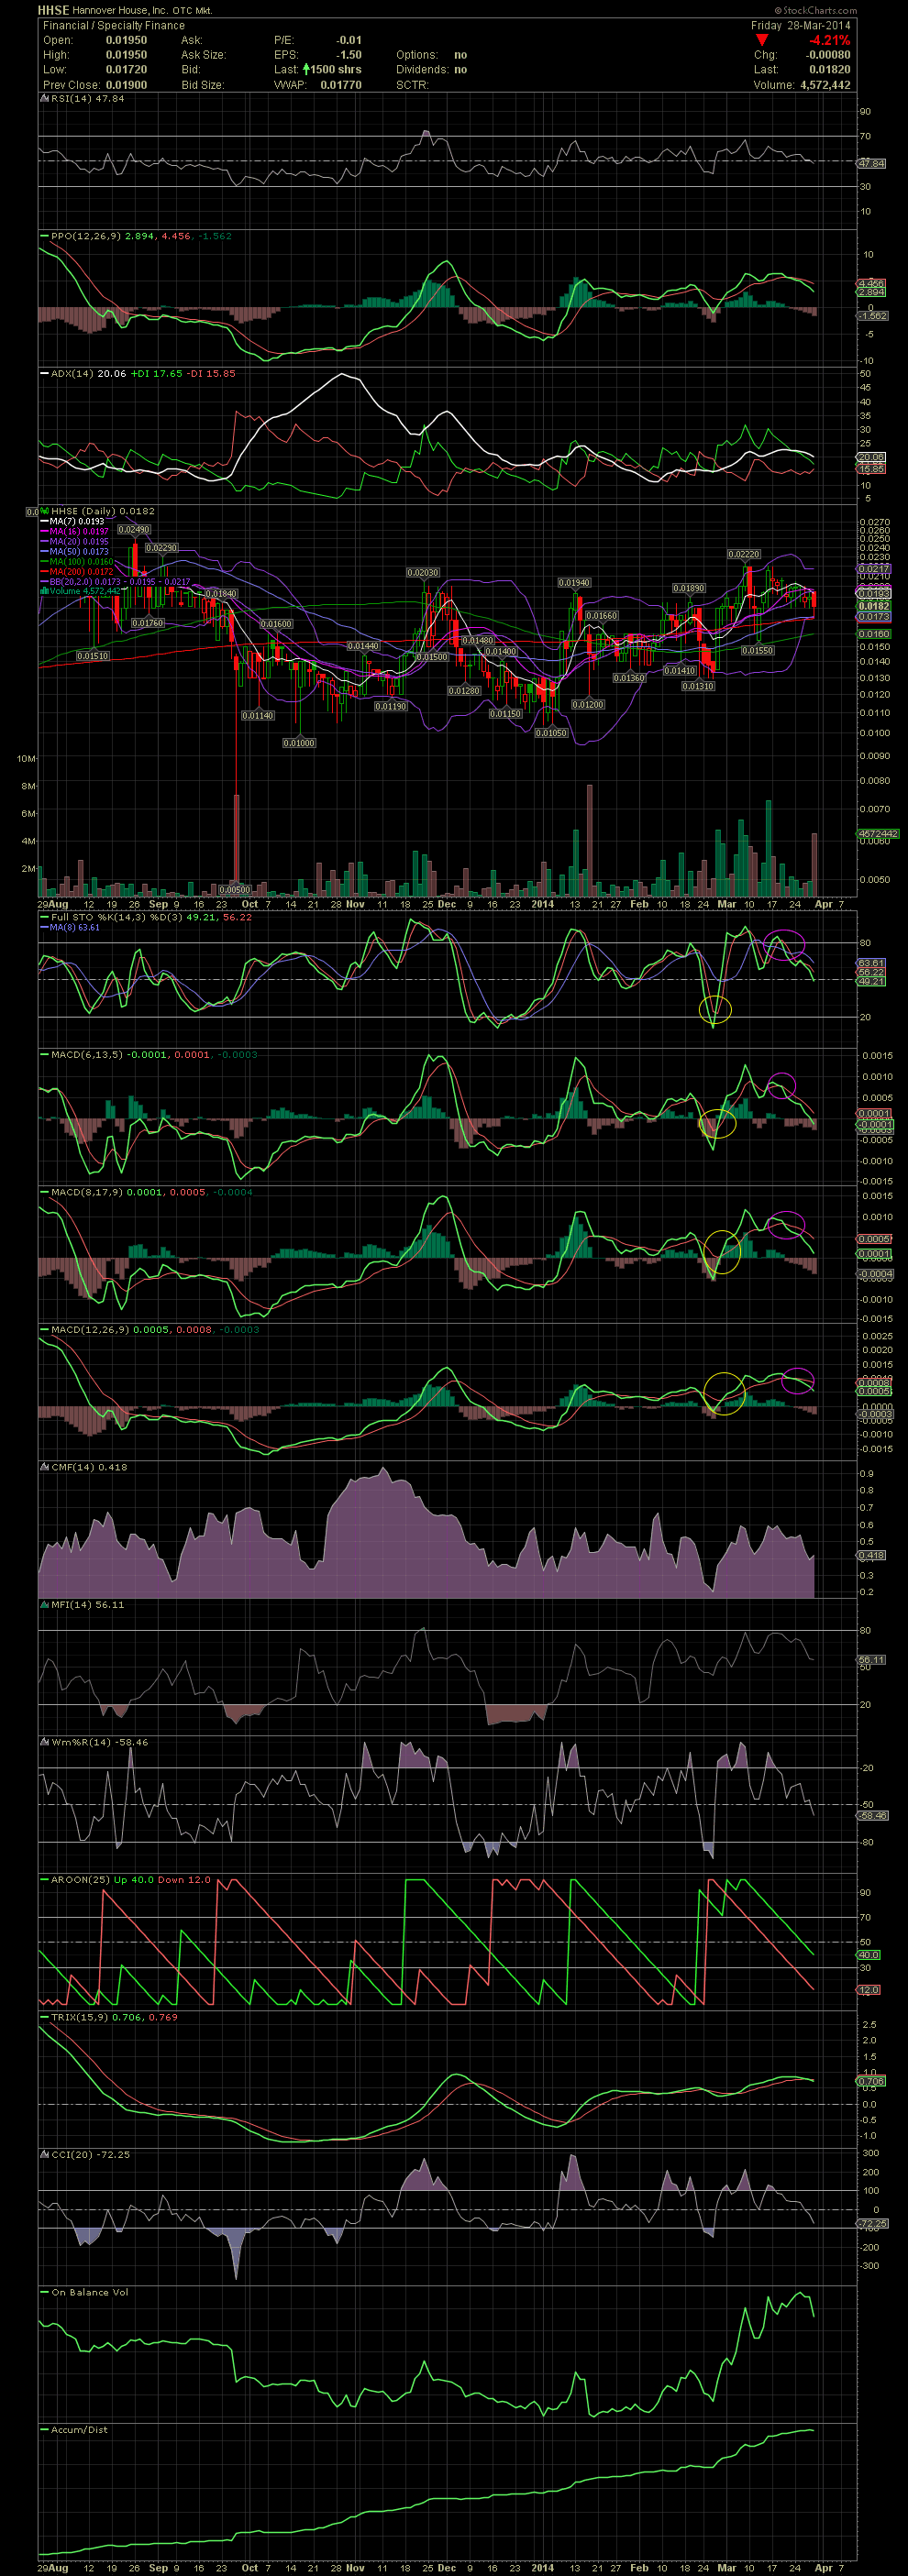
HHSE Daily Chart ~ Declining After Some Indicators
Post# of 2561
Things change quickly in the penny market. A chart that looked fairly good two weeks ago, changed to sell signals with the negative crossovers of the FullSto and MACDs. Although not a big decline, the stock pulled back from the .022 level from my last chart to a low of .0172. I did sell my position earlier this week in the .019s simply because I don't know enough about the fundamentals to warrant hanging on while the technicals are going slightly negative. Immediately below Friday's close are the MA50 and 200, at .0172/.0173. That level will probably hold, but I chose to take my small gains from the .017/.018s and shift those funds into three stocks that should see good movement this week. I don't see a lot of downside in HHSE, just better opportunities for the short term with a few other stocks. GLTA

 (0)
(0) (0)
(0)