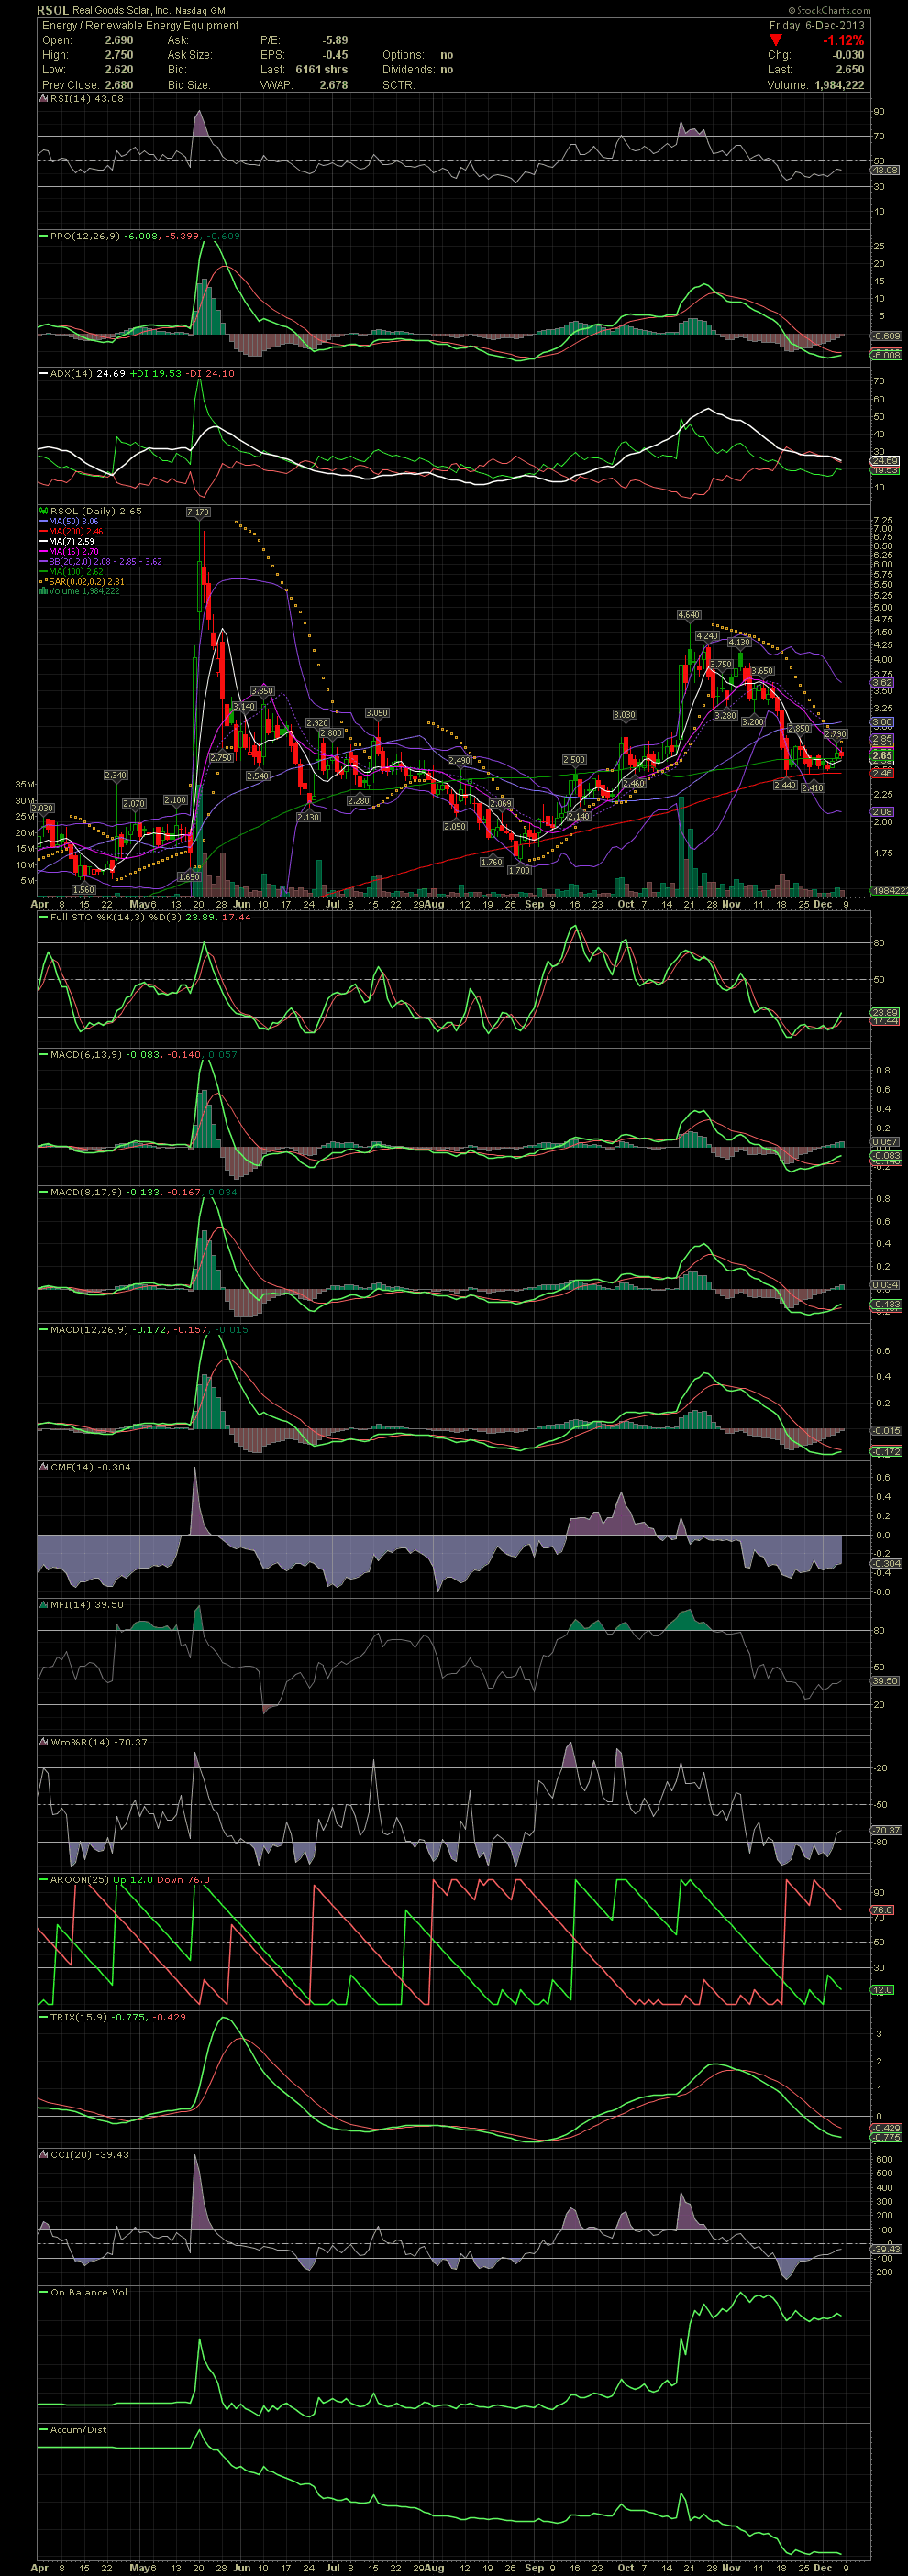
RSOL Daily Chart ~ A Possible Move to the $3.20s A
Post# of 2561

I bought a few RSOL on Friday at 2.66 to 2.76. What I'm looking at here specifically is the basing and bottom that the stock put on over the last few weeks while using the MA200 as solid support. I chose to enter on Friday after the stock closed above the MA100 on Thursday. I also like that the FullSto and MACDs (except the 12 day MACD) have already crossed to the positive from very low levels. Most of the other indicators are bouncing off their lows. Just above are the MA16 and 20s at 2.70 and 2.85 followed by the MA50 at 3.06. Should those three MA's be recaptured, I think the 3.65 and 4.13 of early November could be seen. GLTA

 (0)
(0) (0)
(0)