NVAX Daily Chart ~ Slow and Steady Continues to Ba
Post# of 2561
Posted On: 12/08/2013 4:27:12 PM

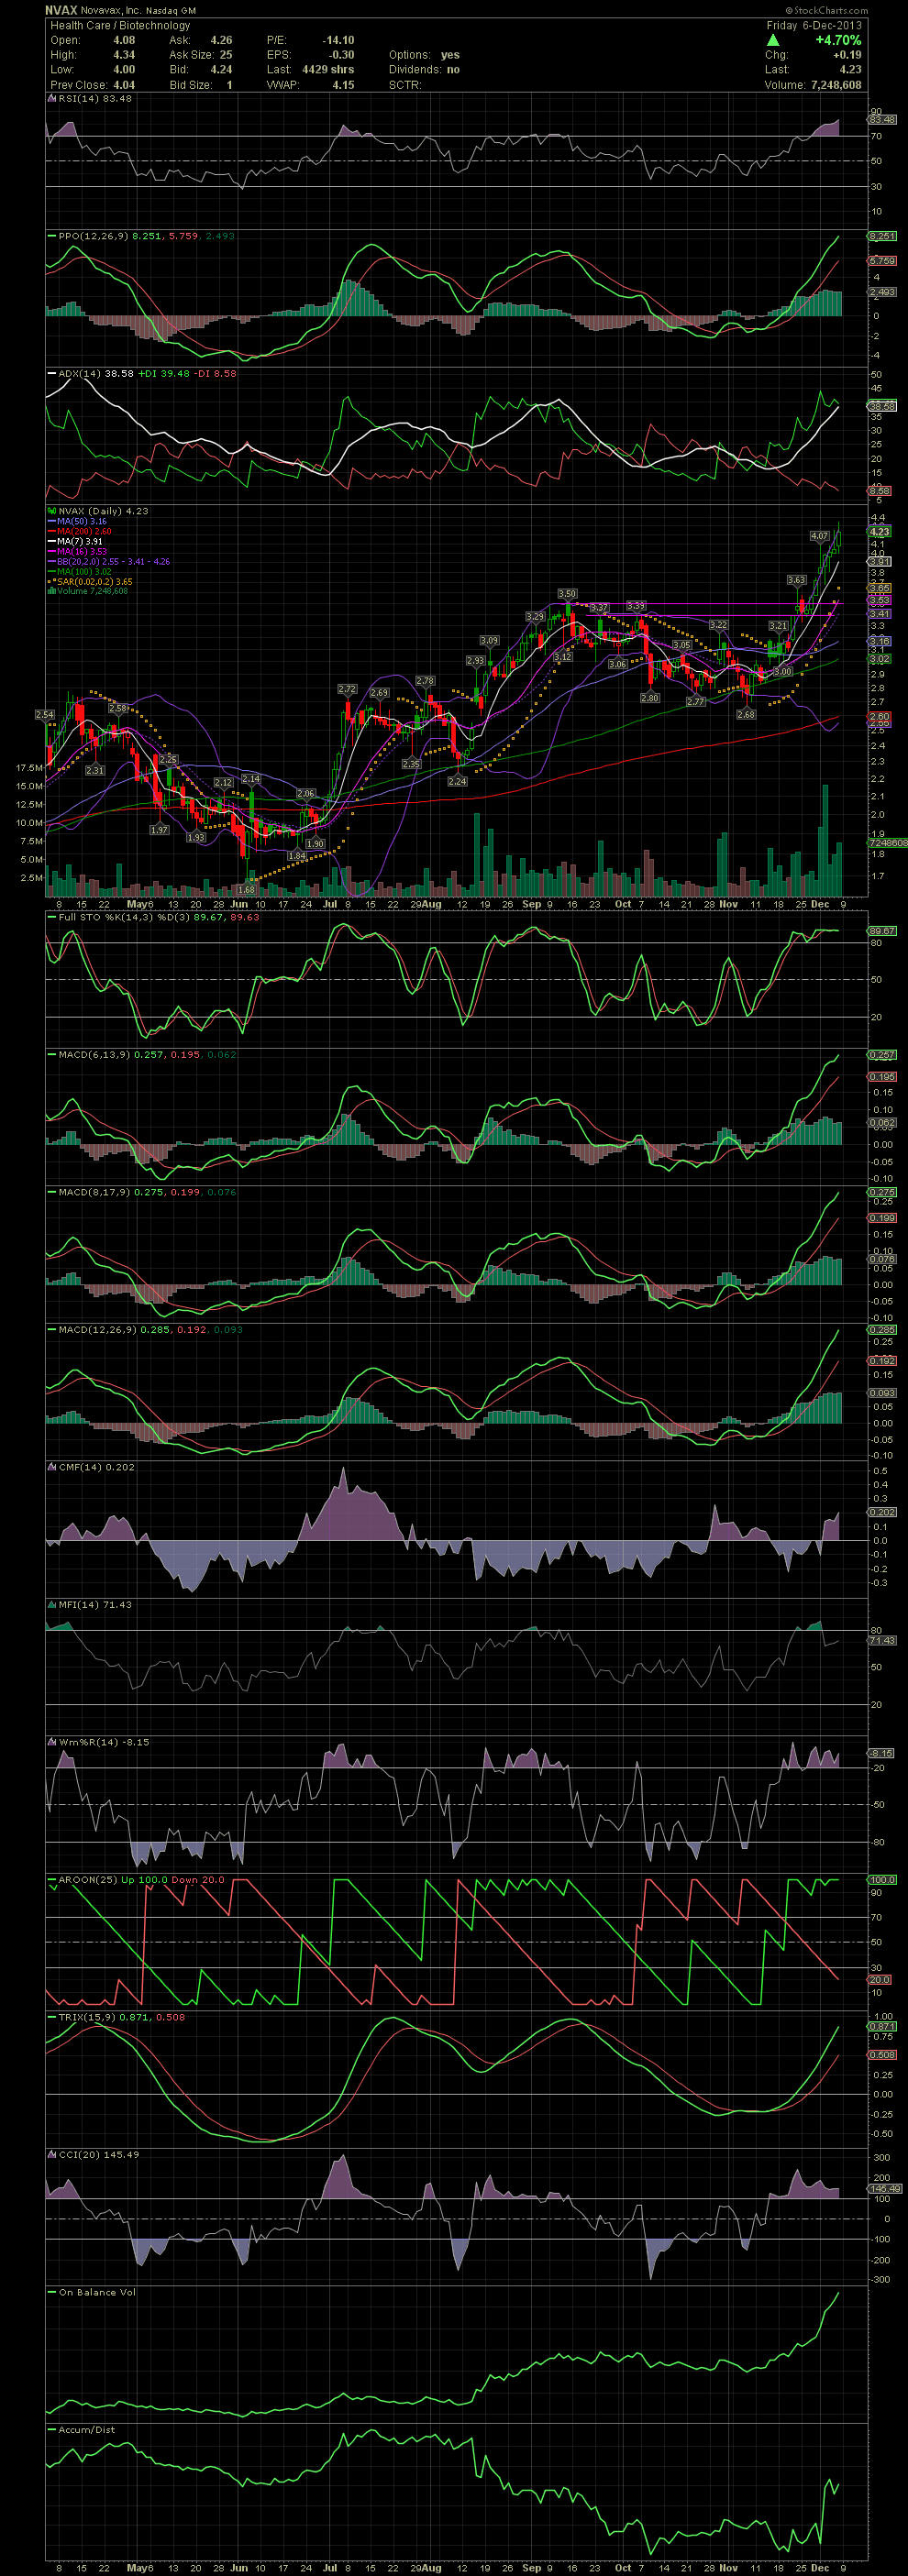
NVAX Daily Chart ~ Slow and Steady Continues to Bank for Us
NVAX continued its rise this last week with a weekly gain of 13.71%. For a few of us, this swing trade is now up 45% over the last 15 days. Not bad so far for a Big Board swing trade. NVAX treated a few of us well back in June and August. The current leg has been Blue Skyin' for us since breaking above the horizontal resistance line seen on the chart. The stock is trading beautifully while riding the MA7 and surfing the upper bollie with only a few violations along the way. NVAX is getting over extended as most indicators are fairly overbought. Don't be surprised to see me posting that I've sold over the next few days, but let's allow the chart to continue doing the talking. A couple of you asked me what to look for since NVAX hasn't seen these levels since 2009. Scroll below the Daily Chart for a look at a Monthly Chart. Look at the price tags of 4.38, 5.48, 7.79 and 8.39, although those levels haven't been seen since 2006 to 2009. I would consider those long term targets. So continue to use the daily charts to make your swing trading decisions. GLTA
NVAX Monthly Chart
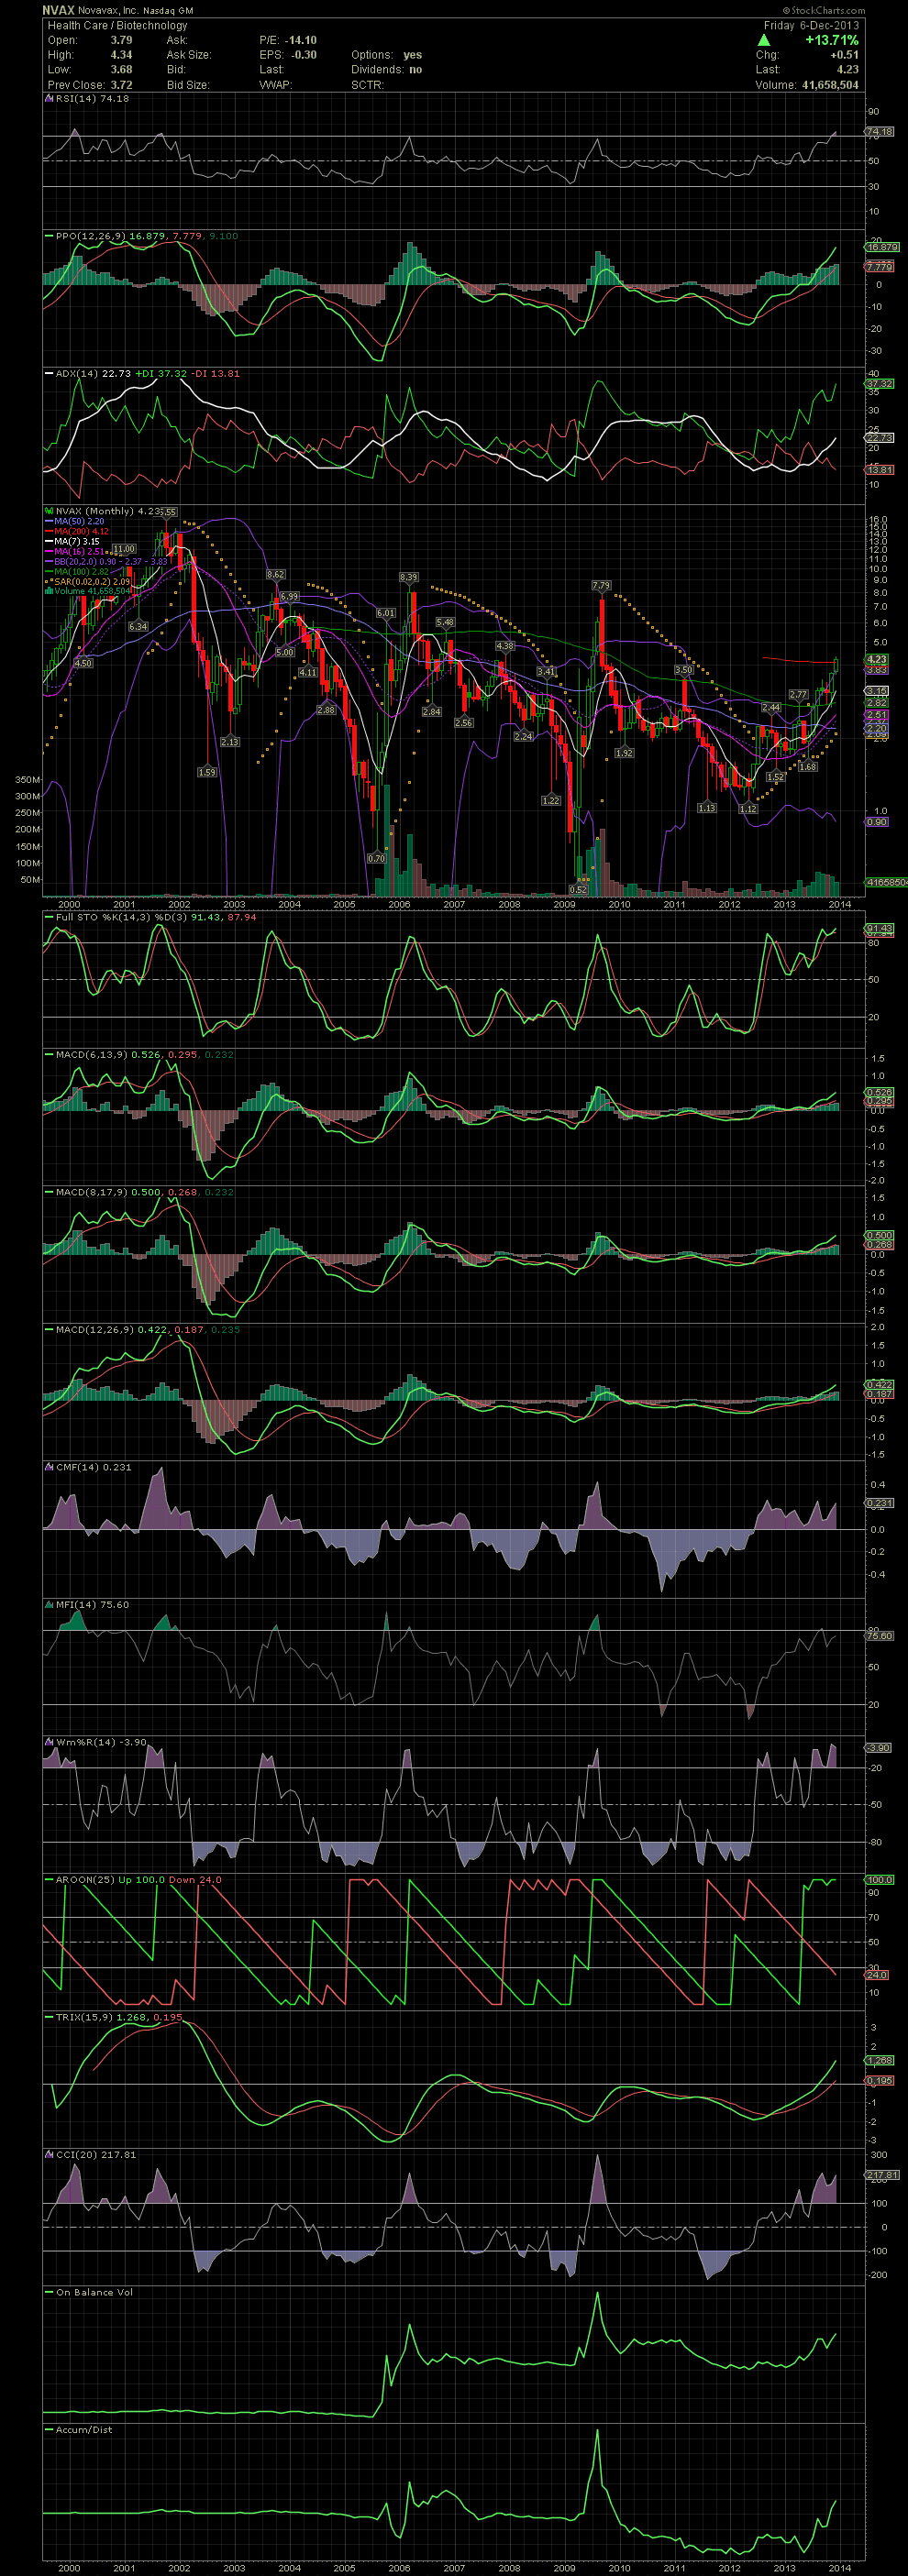
 (0)
(0) (0)
(0)