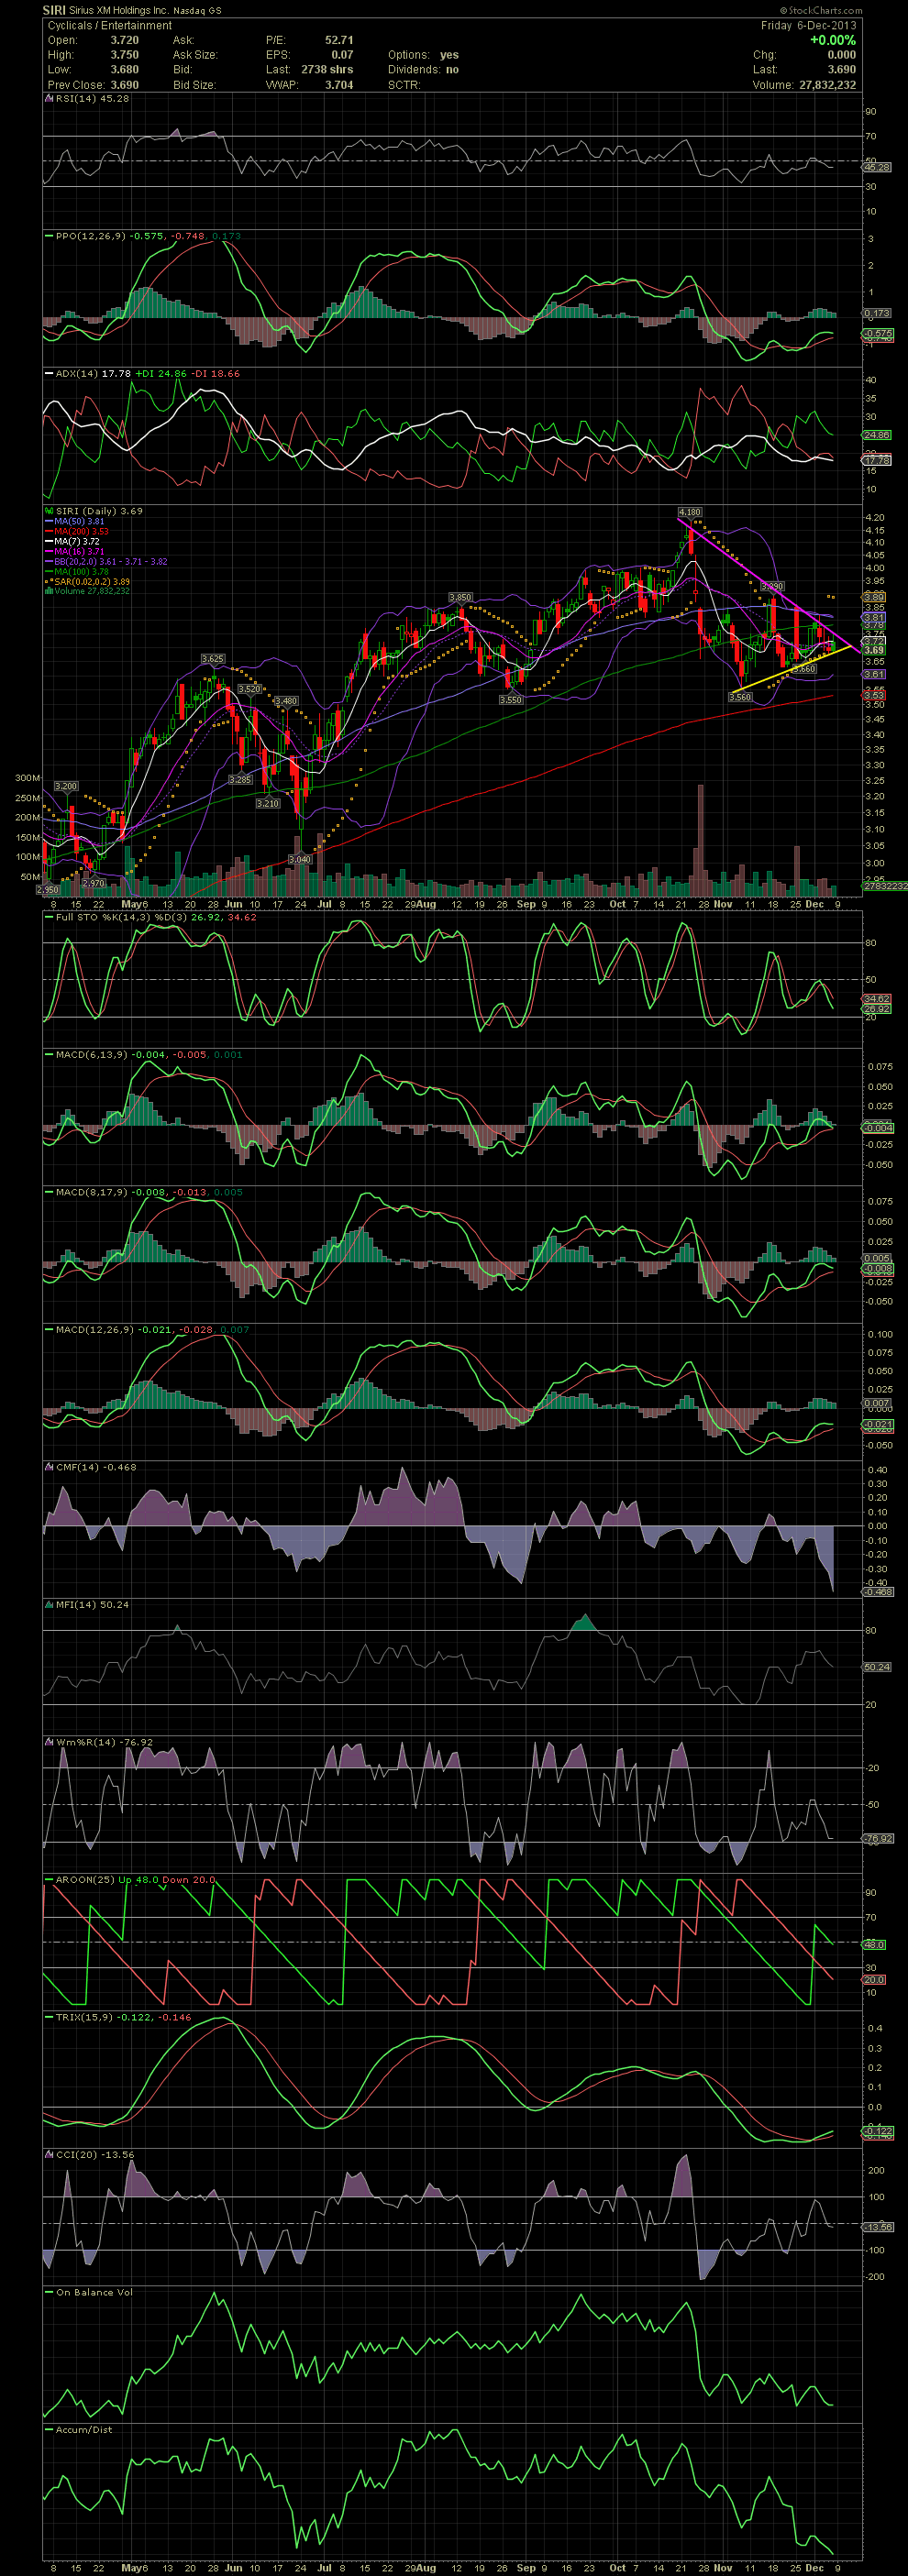
SIRI Daily Chart ~ Looking for a Re-entry After a
Post# of 2561

My last trade on SIRI was only good for .06 to .12. But that's better than losing. What I was hoping for was a breakout over the declining tops line which failed to occur the entire week. The stock closed on the short term rising bottom as seen on the chart. Just above is the MA100 and 50 at 3.78 and 3.81. I am looking to get back in but want to see the FullSto and MACDs begin curling up again. Should the stock break under the rising support line, SIRI could see the previous lows of 3.66 and 3.55/3.56. SIRI is up nicely for the year so I do not anticipate much in the way of year end tax loss selling. Actually, now that I'm out of the stock, can someone arrange for the stock to sell off to the lows of mid April at just under 3.00, lol. Would be nice to roll into SIRI at that level. I have to tell you, though, SIRI is really, really boring but good for consistent swing trades of 10-20% every couple of months. GLTA

 (0)
(0) (0)
(0)