Posted On: 02/16/2014 7:26:12 PM
Post# of 338555

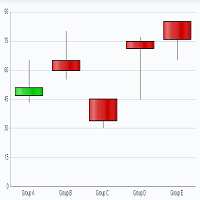
ACI 3.970 Stock Chart Sunday, February 16, 2014 7:26:10 PM
Date Open High Low Close Volume Open Interest
02/14/14 3.970 4.100 3.950 4.090 7,624,700 0
02/13/14 3.840 3.970 3.830 3.950 6,125,500 0
02/12/14 4.000 4.050 3.900 3.900 7,706,300 0
02/11/14 3.980 4.040 3.890 3.950 12,439,900 0
02/10/14 3.920 3.970 3.870 3.960 8,731,400 0
02/07/14 3.910 3.970 3.820 3.910 11,223,400 0
02/06/14 3.970 3.990 3.790 3.890 15,601,300 0
02/05/14 4.150 4.150 3.890 3.920 21,379,900 0
02/04/14 4.010 4.260 3.900 4.230 19,103,600 0
02/03/14 4.260 4.290 4.010 4.010 12,294,300 0
http://chart.eoddata.com/?e=NYSE&s=ACI&am...0689699681
