Posted On: 01/28/2014 12:44:15 AM
Post# of 338556

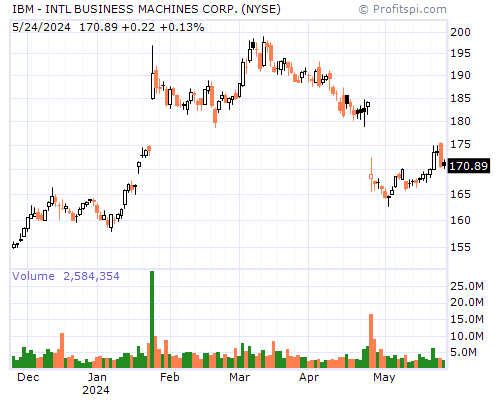
IBM Stock Chart and Technical Analysis - Mon, Jan 27th, 2014 $IBM
Period Moving Average Price Change Percent Change Average Volume
5 Day 182.19 -12.19 -6.41% 8,808,800
20 Day 185.86 -7.45 -4.02% 5,665,565
50 Day 182.07 -5.17 -2.82% 5,270,832
100 Day 182.94 -6.06 -3.29% 5,013,931
200 Day 190.02 -35.02 -16.45% 4,586,902
Year to Date 185.77 -9.67 -5.16% 6,075,900
Period Raw Stochastic Stochastic %K Stochastic %D Average True Range
9 Day 1.83% 17.48% 31.69% 3.20
14 Day 1.83% 17.48% 31.69% 3.03
20 Day 1.83% 17.48% 34.40% 2.91
50 Day 28.60% 40.71% 51.46% 2.74
100 Day 23.88% 33.69% 42.40% 2.74
Period Relative Strength Percent R Historic Volatility MACD Oscillator
9 Day 30.39% 98.17% 21.67% -4.74
14 Day 37.65% 98.17% 20.98% -5.62
20 Day 41.80% 98.17% 18.70% -5.77
50 Day 46.00% 71.40% 17.12% -1.98
100 Day 46.82% 76.12% 19.62% -2.85