Posted On: 01/28/2014 12:43:53 AM
Post# of 338556

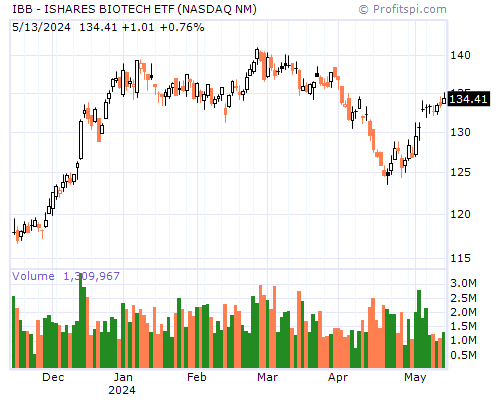
IBB Stock Chart and Technical Analysis - Mon, Jan 27th, 2014 $IBB
Period Moving Average Price Change Percent Change Average Volume
5 Day 248.22 -8.83 -3.57% 1,533,840
20 Day 237.30 +11.36 +5.00% 1,012,510
50 Day 225.95 +32.31 +15.66% 872,116
100 Day 216.27 +40.75 +20.60% 937,863
200 Day 199.55 +71.17 +42.51% 846,329
Year to Date 239.19 +11.54 +5.08% 1,123,106
Period Raw Stochastic Stochastic %K Stochastic %D Average True Range
9 Day 22.29% 55.24% 77.64% 5.38
14 Day 46.94% 70.31% 85.29% 4.94
20 Day 51.26% 71.75% 85.78% 4.66
50 Day 69.06% 82.15% 91.05% 4.17
100 Day 75.31% 85.69% 92.80% 3.78
Period Relative Strength Percent R Historic Volatility MACD Oscillator
9 Day 47.07% 77.71% 31.69% -1.78
14 Day 53.56% 53.06% 28.57% +3.03
20 Day 56.55% 48.74% 24.88% +7.82
50 Day 58.75% 30.94% 21.72% +19.17
100 Day 58.75% 24.69% 22.83% +28.85