Posted On: 01/27/2014 2:22:19 AM
Post# of 338555

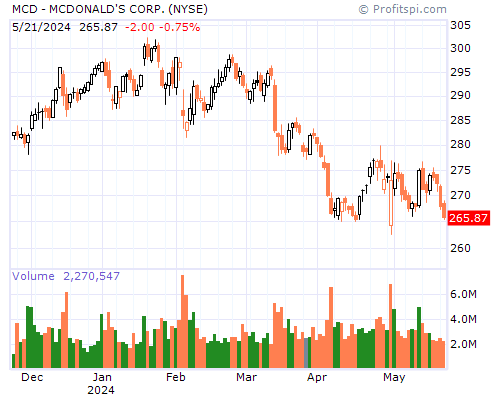
MCD Stock Chart and Technical Analysis - Mon, Jan 27th, 2014 $MCD
Period Moving Average Price Change Percent Change Average Volume
5 Day 94.93 -1.63 -1.70% 6,325,360
20 Day 95.79 -2.11 -2.19% 4,771,190
50 Day 96.26 -2.66 -2.74% 5,465,822
100 Day 96.18 +0.07 +0.07% 4,939,526
200 Day 97.65 -7.06 -6.96% 4,975,243
Year to Date 95.50 -2.60 -2.68% 5,412,788
Period Raw Stochastic Stochastic %K Stochastic %D Average True Range
9 Day 2.09% 21.38% 23.55% 1.05
14 Day 1.49% 14.97% 16.96% 1.01
20 Day 1.38% 13.89% 15.75% 0.99
50 Day 7.46% 16.00% 17.93% 1.00
100 Day 21.04% 28.33% 29.98% 1.04
Period Relative Strength Percent R Historic Volatility MACD Oscillator
9 Day 38.11% 97.91% 10.82% -0.26
14 Day 41.21% 98.51% 10.21% -0.49
20 Day 43.25% 98.62% 9.03% -0.92
50 Day 46.57% 92.54% 11.42% -1.38
100 Day 48.31% 78.96% 10.62% -1.30