Posted On: 01/27/2014 2:21:56 AM
Post# of 338555

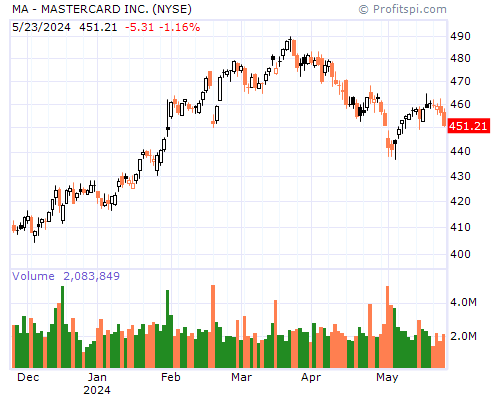
MA Stock Chart and Technical Analysis - Mon, Jan 27th, 2014 $MA
Period Moving Average Price Change Percent Change Average Volume
5 Day 81.57 -4.04 -4.89% 9,357,660
20 Day 82.61 -2.81 -3.46% 7,954,865
50 Day 79.15 +4.39 +5.93% 6,968,506
100 Day 74.01 +17.90 +29.54% 6,332,643
200 Day 66.10 +25.07 +46.90% 6,327,606
Year to Date 82.52 -5.04 -6.03% 8,350,394
Period Raw Stochastic Stochastic %K Stochastic %D Average True Range
9 Day 0.19% 37.23% 43.21% 1.75
14 Day 0.16% 37.22% 43.21% 1.55
20 Day 0.16% 37.22% 43.99% 1.44
50 Day 46.20% 71.40% 78.08% 1.25
100 Day 73.68% 85.98% 88.95% 1.14
Period Relative Strength Percent R Historic Volatility MACD Oscillator
9 Day 30.72% 99.81% 30.85% -0.38
14 Day 38.50% 99.84% 26.90% -1.03
20 Day 44.62% 99.84% 23.68% -1.22
50 Day 55.54% 53.80% 18.74% +2.24
100 Day 58.45% 26.32% 18.84% +7.38