Posted On: 01/27/2014 2:22:42 AM
Post# of 338555

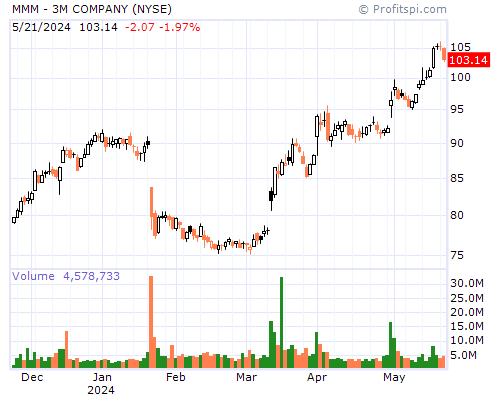
MMM Stock Chart and Technical Analysis - Mon, Jan 27th, 2014 $MMM
Period Moving Average Price Change Percent Change Average Volume
5 Day 135.14 -7.94 -5.75% 2,732,840
20 Day 137.14 -6.77 -4.94% 2,528,430
50 Day 133.09 +2.27 +1.77% 2,958,444
100 Day 127.11 +16.64 +14.65% 2,698,400
200 Day 119.41 +22.53 +20.92% 2,652,031
Year to Date 136.60 -10.03 -7.15% 2,684,669
Period Raw Stochastic Stochastic %K Stochastic %D Average True Range
9 Day 38.02% 43.49% 2.09
14 Day 32.00% 35.61% 1.96
20 Day 28.54% 32.43% 1.88
50 Day 33.18% 56.63% 68.37% 1.68
100 Day 62.98% 76.02% 82.59% 1.55
Period Relative Strength Percent R Historic Volatility MACD Oscillator
9 Day 24.05% 100.00% 21.69% -2.24
14 Day 34.01% 100.00% 17.74% -2.55
20 Day 40.93% 100.00% 17.16% -3.34
50 Day 52.14% 66.82% 19.18% +0.72
100 Day 55.64% 37.02% 15.76% +6.69