Posted On: 01/27/2014 2:21:34 AM
Post# of 338555

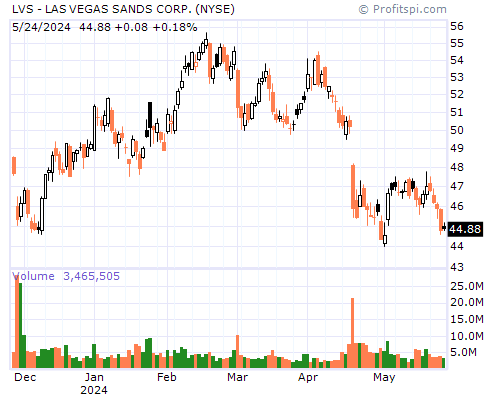
LVS Stock Chart and Technical Analysis - Mon, Jan 27th, 2014 $LVS
Period Moving Average Price Change Percent Change Average Volume
5 Day 79.41 -6.96 -8.61% 6,361,700
20 Day 79.47 -3.74 -4.82% 4,446,520
50 Day 76.03 +3.51 +4.99% 4,156,890
100 Day 71.50 +17.56 +31.16% 4,488,658
200 Day 63.68 +18.41 +33.17% 4,730,633
Year to Date 79.69 -4.96 -6.29% 4,877,994
Period Raw Stochastic Stochastic %K Stochastic %D Average True Range
9 Day 0.70% 25.48% 52.96% 2.05
14 Day 0.70% 33.27% 60.83% 1.86
20 Day 0.70% 34.48% 62.12% 1.75
50 Day 36.94% 64.92% 81.28% 1.58
100 Day 66.38% 81.55% 90.23% 1.49
Period Relative Strength Percent R Historic Volatility MACD Oscillator
9 Day 26.44% 99.30% 35.67% -2.12
14 Day 35.08% 99.30% 34.96% -2.09
20 Day 41.29% 99.30% 30.79% -1.77
50 Day 52.33% 63.06% 23.87% +1.67
100 Day 55.25% 33.62% 23.39% +6.20