Posted On: 01/01/2014 5:53:31 PM
Post# of 2561

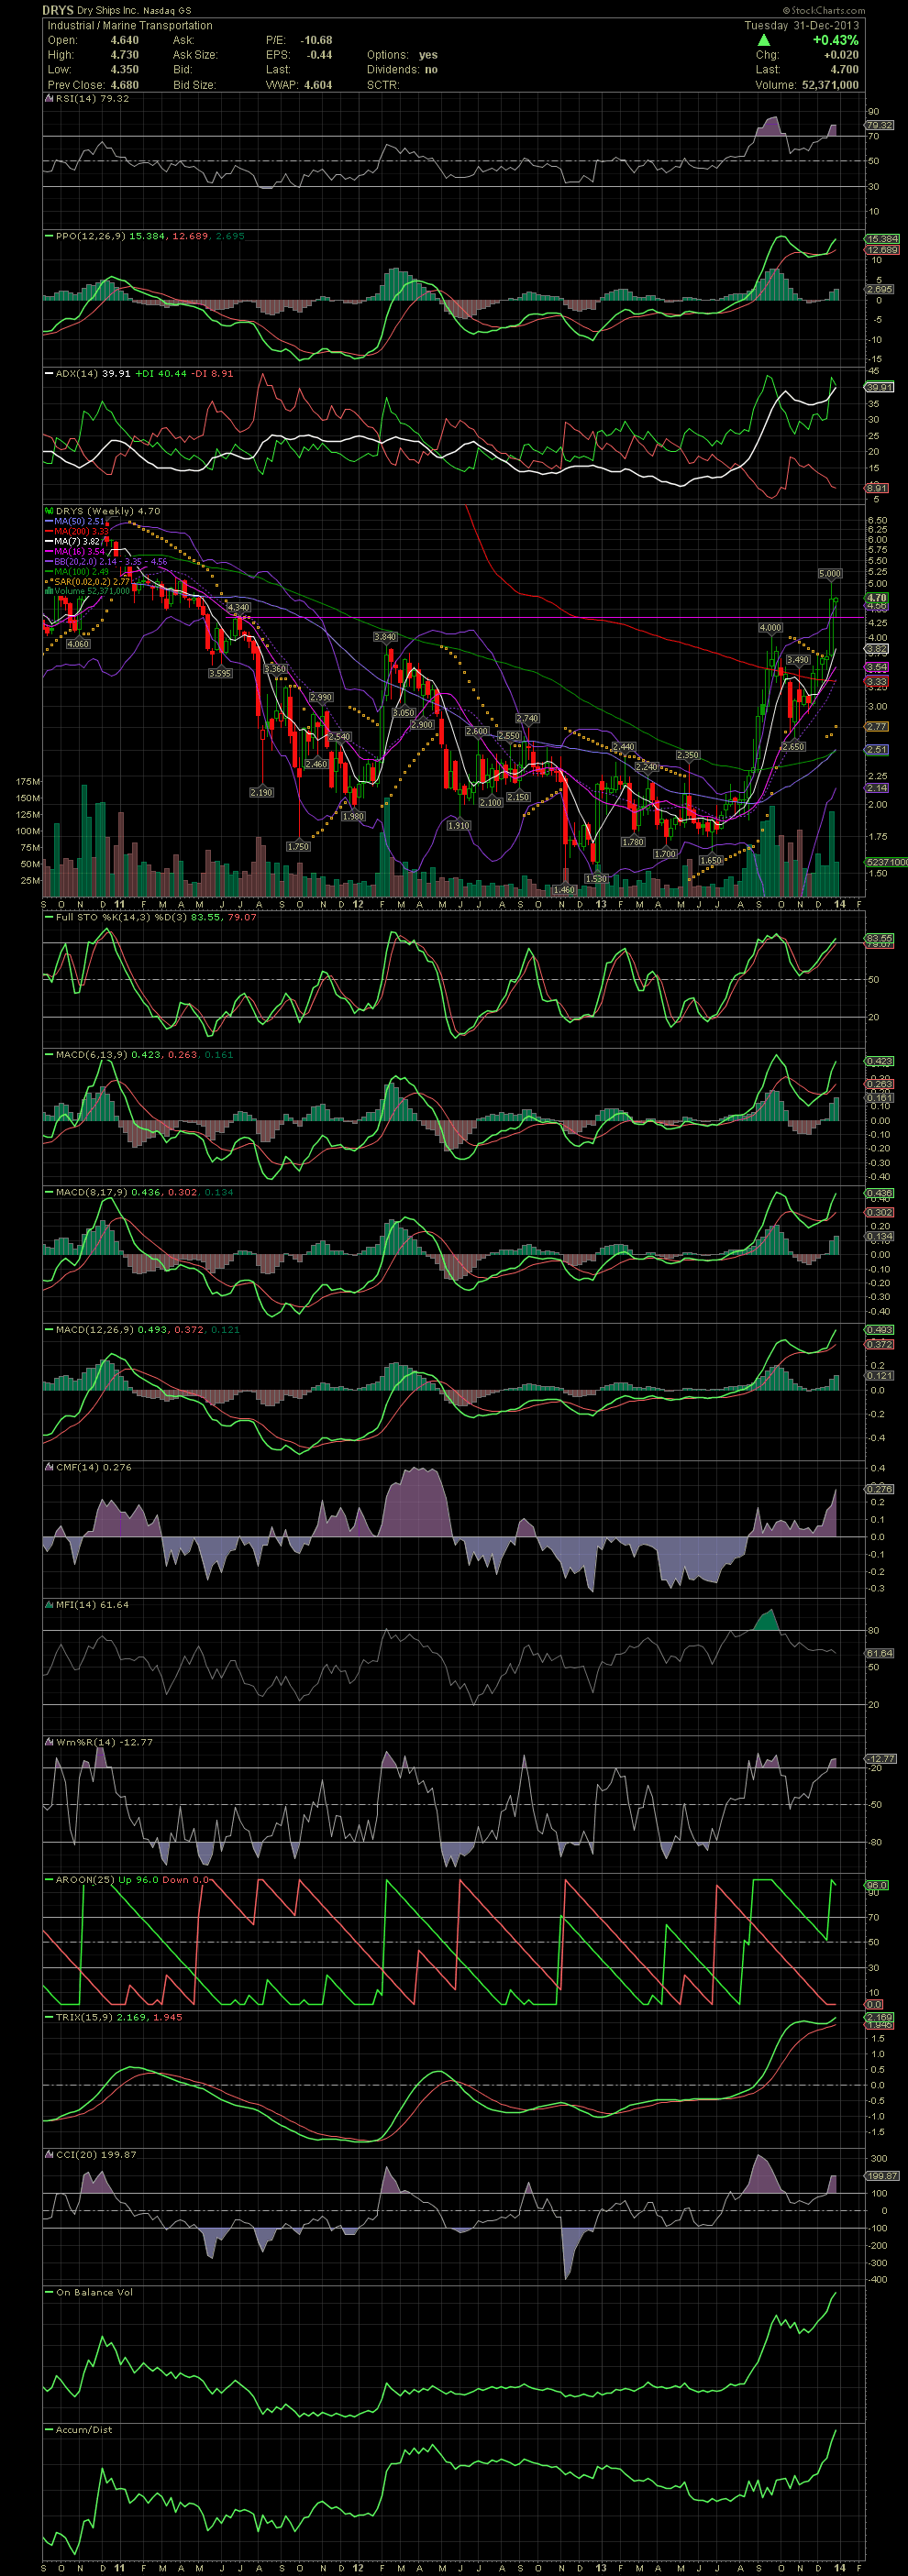
DRYS Weekly Chart ~ New Multi Year Highs
Been talking about the eventual break above the previous highs of 3.84, 4.00, and 4.34. On the Weekly, the candle is outside of the upper bollie for the second week. But as in Feb 2012 and again in Oct 2013, what was outside the bollie came back inside the bollie. It always does. Now, whether the stock consolidates with a sideways move back inside or with a decline in share price, your guess is as good as mine. But when those FullSto and MACDs begin to curl and cross to the downside, look out below. Better to take some profits now and then, than to ride a negative crossover to mucho losses. GLTA

Been talking about the eventual break above the previous highs of 3.84, 4.00, and 4.34. On the Weekly, the candle is outside of the upper bollie for the second week. But as in Feb 2012 and again in Oct 2013, what was outside the bollie came back inside the bollie. It always does. Now, whether the stock consolidates with a sideways move back inside or with a decline in share price, your guess is as good as mine. But when those FullSto and MACDs begin to curl and cross to the downside, look out below. Better to take some profits now and then, than to ride a negative crossover to mucho losses. GLTA

