Posted On: 01/01/2014 6:01:22 PM
Post# of 2561

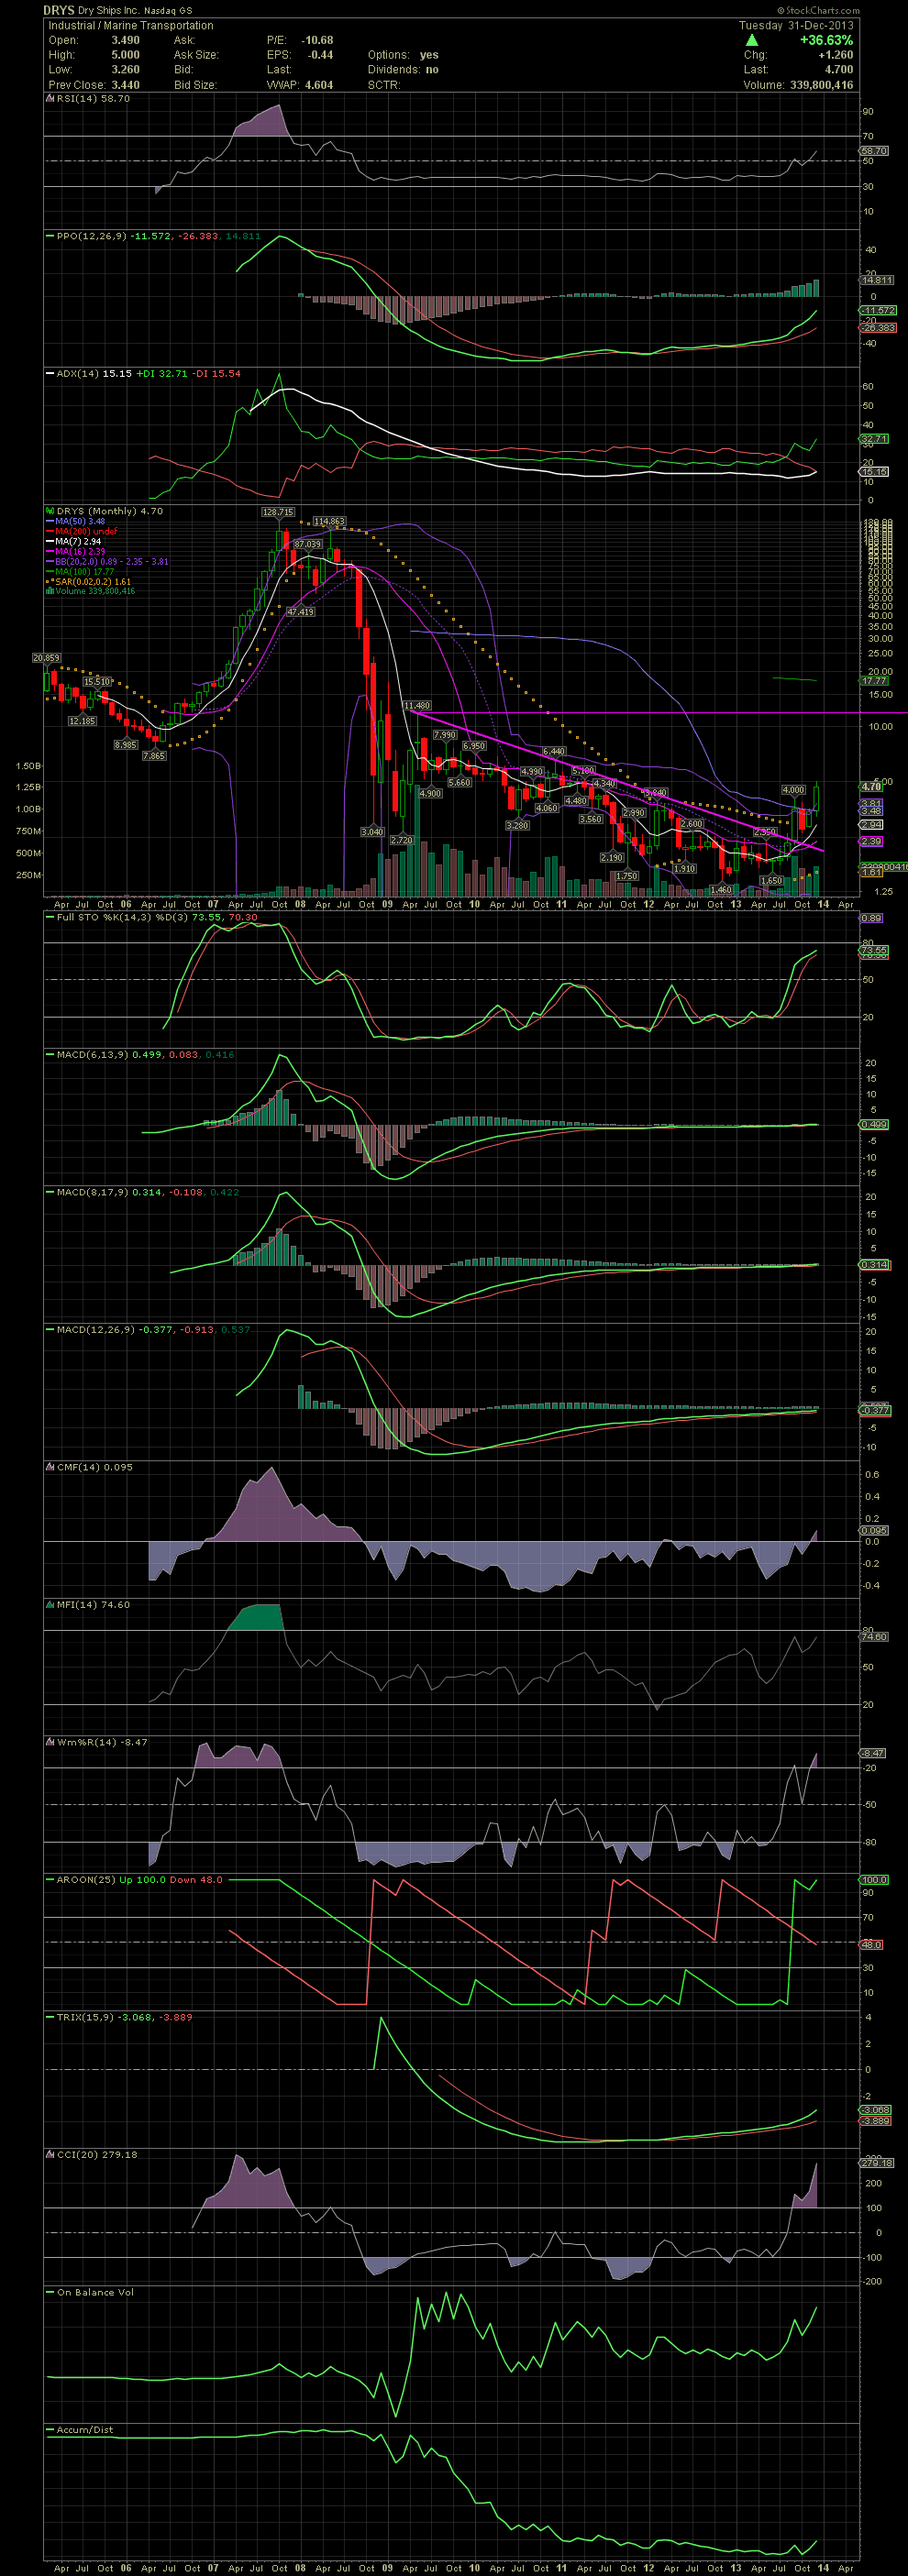
DRYS Monthly Charts ~ A Five Year Decline Was Broken in September
As I've mentioned in the past, use the daily charts and short time frames to time your swing trades. But always look at the Weekly and Monthly Charts to get the big picture. Even I was able to see the multi year breakout to the upside which began in Sept. Since then, DRYS is up more than 100%. There are now numerous levels on the way back up that the stock could achieve, but we'll work off the daily chart. You can see all the price tags of the previous monthly highs of this stock going all the way back to 128.71. Could the stock see those prices again? LOL, excuse me if I don't hold my breath. GLTA
As I've mentioned in the past, use the daily charts and short time frames to time your swing trades. But always look at the Weekly and Monthly Charts to get the big picture. Even I was able to see the multi year breakout to the upside which began in Sept. Since then, DRYS is up more than 100%. There are now numerous levels on the way back up that the stock could achieve, but we'll work off the daily chart. You can see all the price tags of the previous monthly highs of this stock going all the way back to 128.71. Could the stock see those prices again? LOL, excuse me if I don't hold my breath. GLTA