Posted On: 01/01/2014 5:42:07 PM
Post# of 2561

DRYS Daily Chart ~ Breakout to New Highs During the Holidays
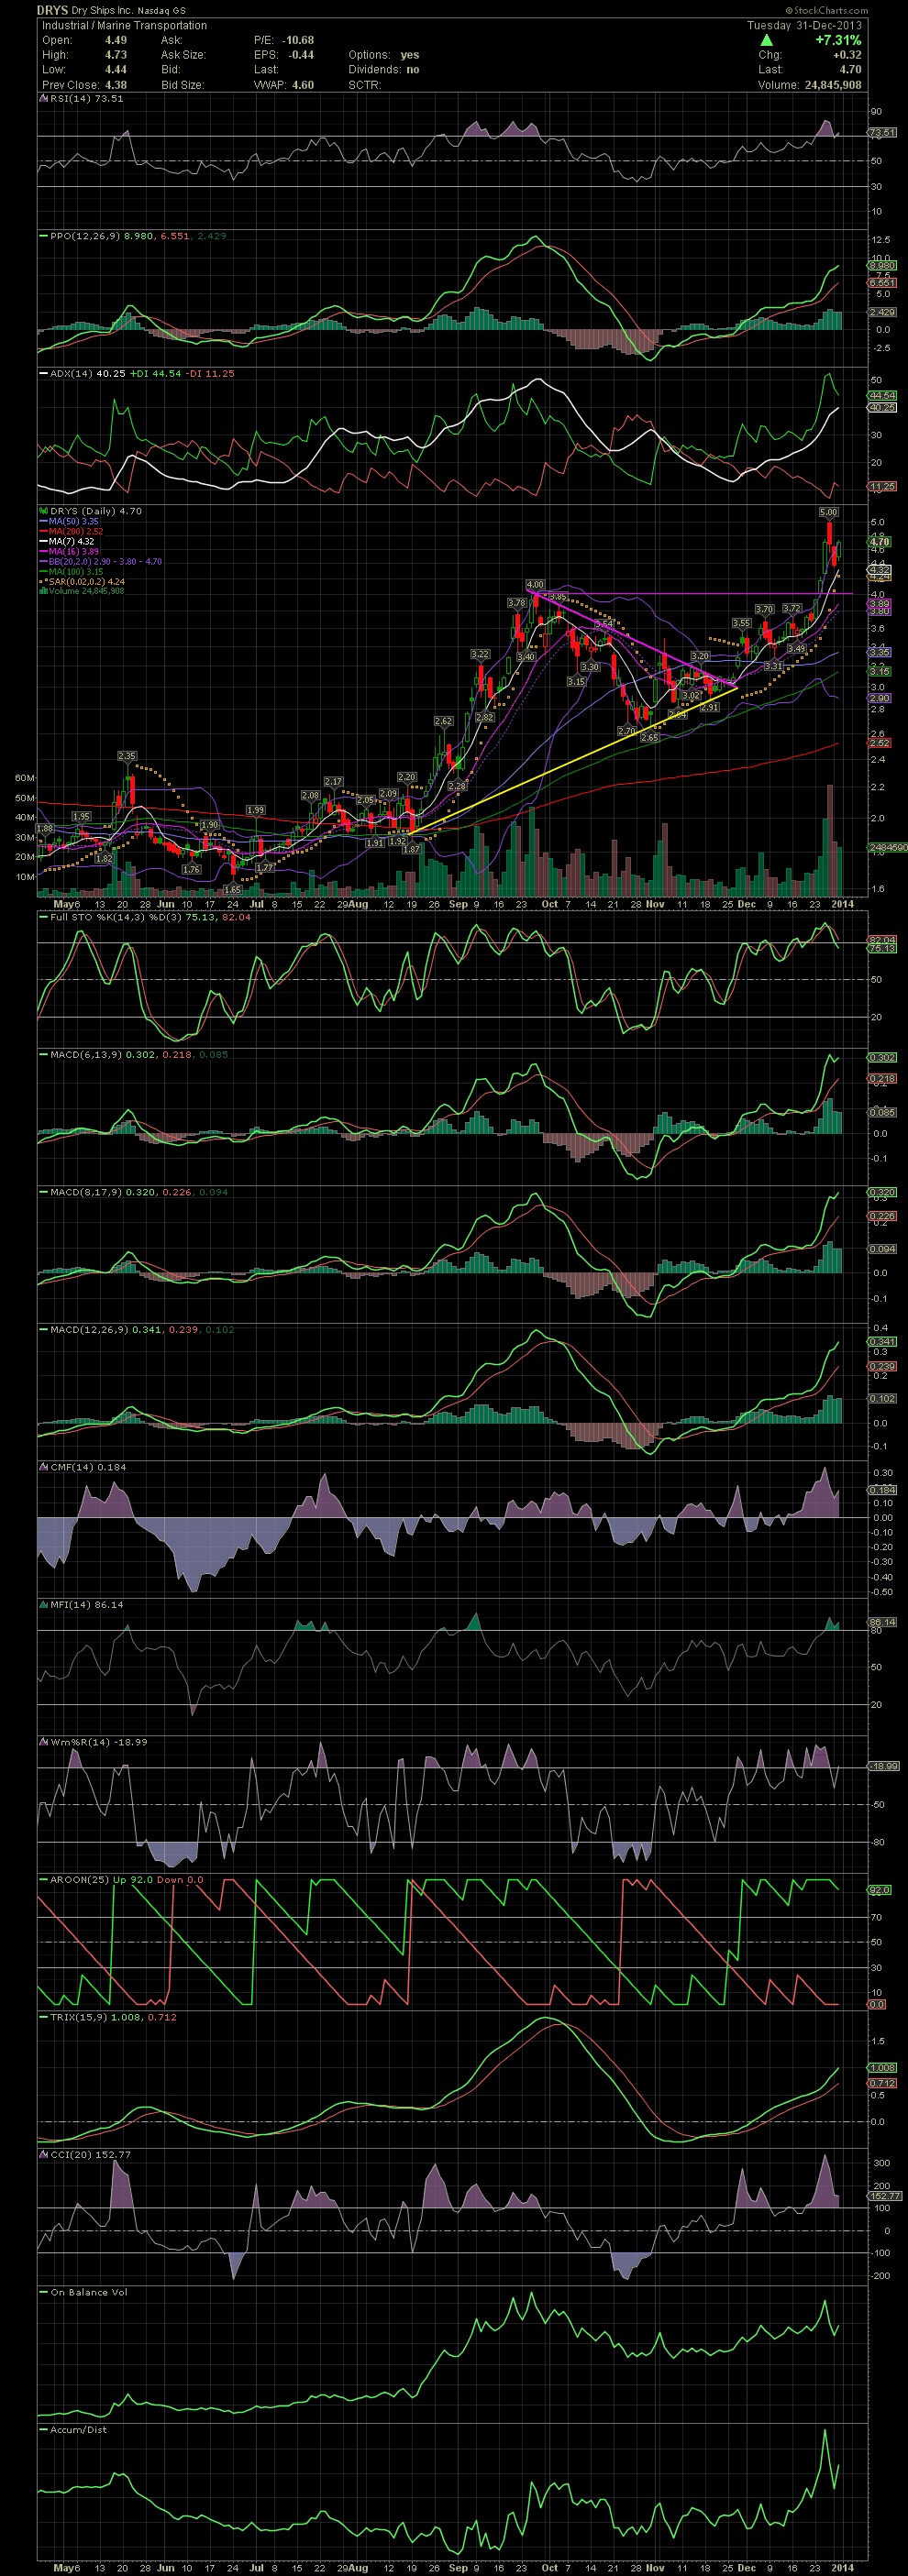
I missed the exit on Friday when I was out of town. Should have paid closer attention using my cell! Friday saw DRYS gap completely outside the upper bollie while opening at 5.00. Had I been around, I would have sold into the move with the intention of buying back into the stock. So after a two day drop to under 4.40, the stock recovered Tuesday to 4.70. I'll be watching DRYS very closely now as the FullSto began to drop. The MACDs are still looking good but also nearly overbought levels. When they begin to level out, I'll be making an exit out of the current swing trade entries of the 3.10s to 3.40s. DRYS has broken to multi year highs, so I'll more than likely be keeping a core position just in case the fund managers decide to buy aggressively, and the stock doesn't fall much. I'll explain in the next two charts, the Weekly and Monthly. GLTA

I missed the exit on Friday when I was out of town. Should have paid closer attention using my cell! Friday saw DRYS gap completely outside the upper bollie while opening at 5.00. Had I been around, I would have sold into the move with the intention of buying back into the stock. So after a two day drop to under 4.40, the stock recovered Tuesday to 4.70. I'll be watching DRYS very closely now as the FullSto began to drop. The MACDs are still looking good but also nearly overbought levels. When they begin to level out, I'll be making an exit out of the current swing trade entries of the 3.10s to 3.40s. DRYS has broken to multi year highs, so I'll more than likely be keeping a core position just in case the fund managers decide to buy aggressively, and the stock doesn't fall much. I'll explain in the next two charts, the Weekly and Monthly. GLTA

