Posted On: 01/01/2014 5:31:34 PM
Post# of 2561

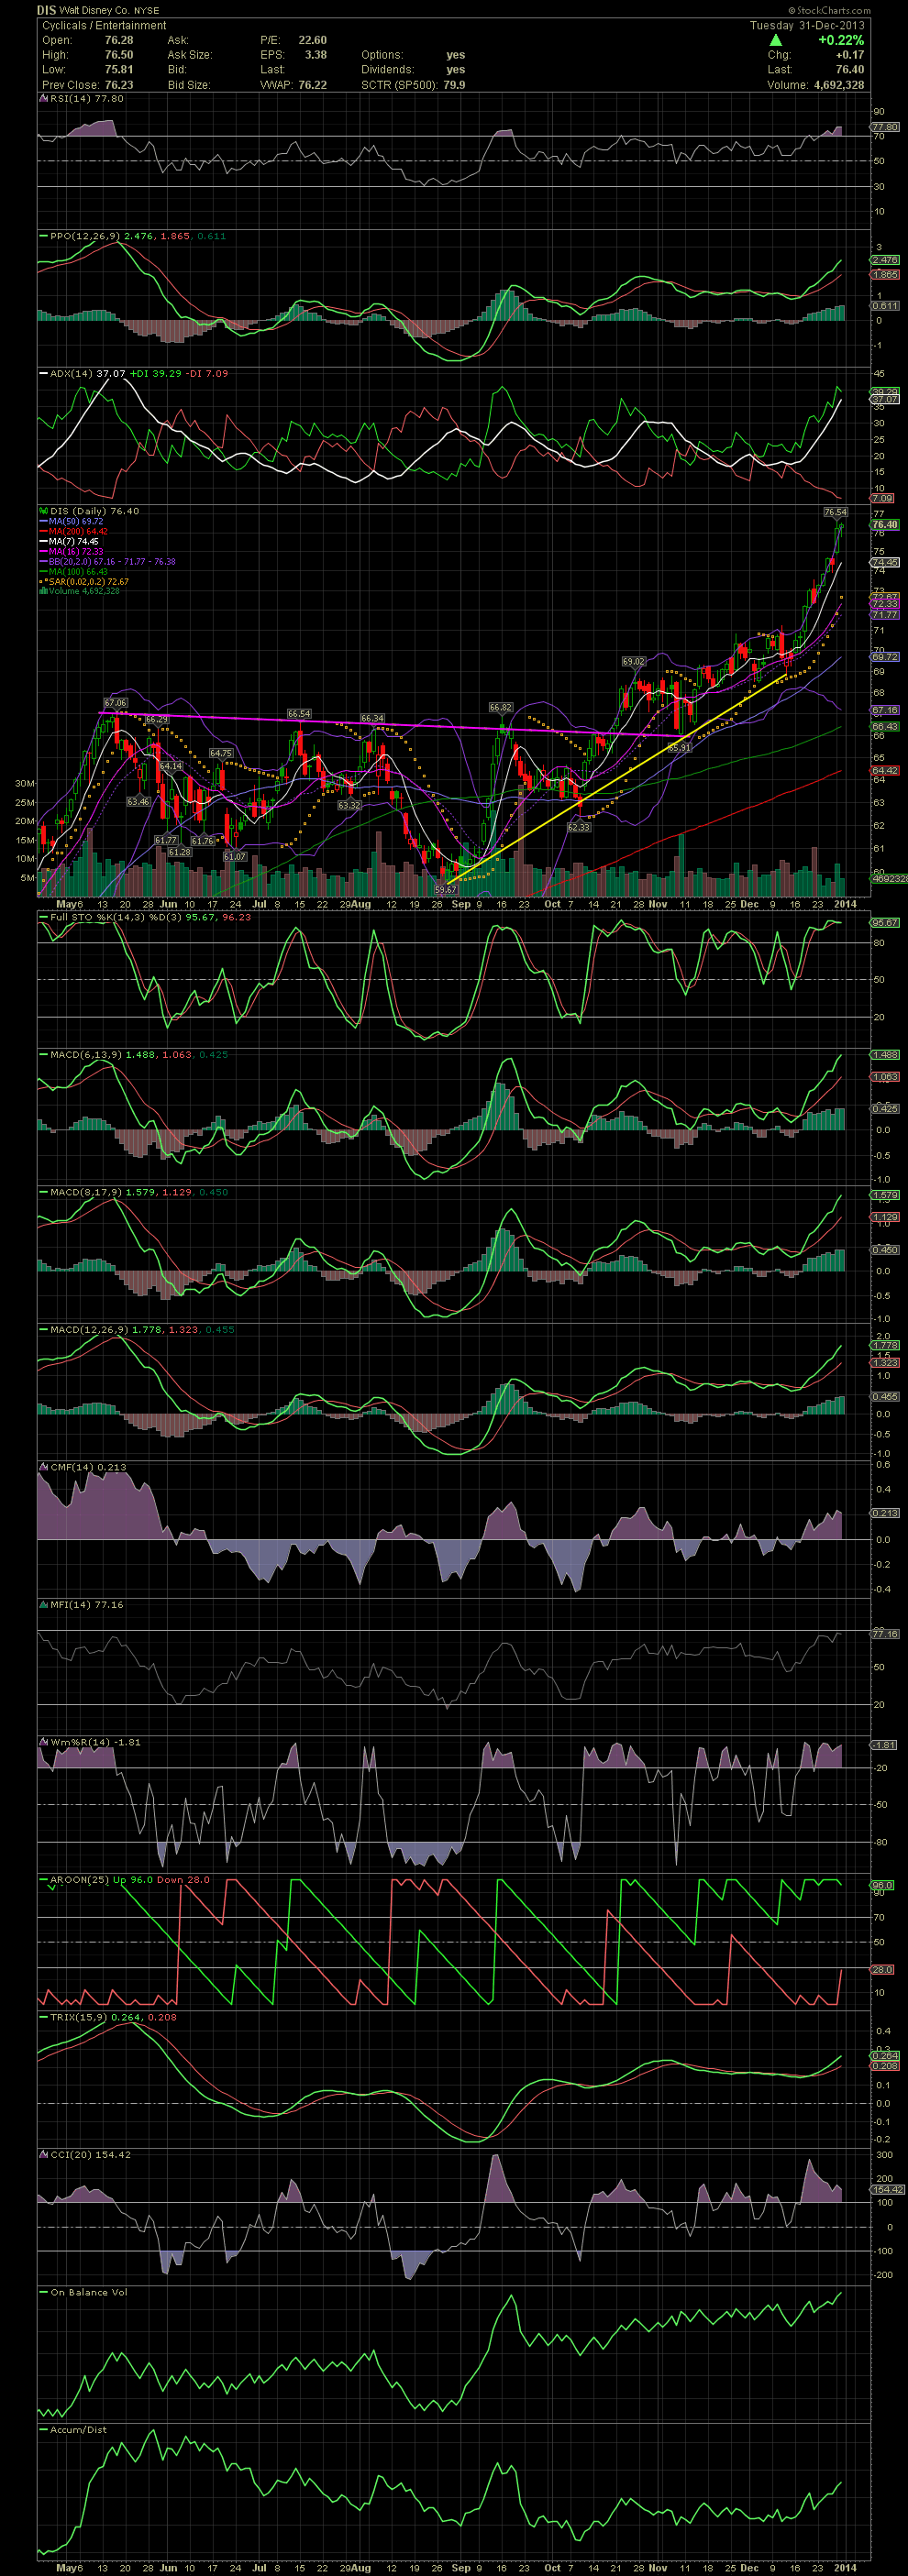
DIS Daily Chart ~ New Highs Almost Daily for a Couple of Weeks
I'm still holding DIS since my entry back in mid October. The run of the last two weeks could probably be attributed to the fund sheeple jumping in to pretent to their shareholders that they've been in DIS for months, lol. I'll be keeping an eye on the indicators now for a possilbe pullback. The FullSto is clearly in overbought territory while the MACDs are getting there too. Although not as critical with the Big Boards, when the indicators get too frothy in penny stocks, one can't hit the sell button too fast after a run into overbought levels. The current move in DIS is similar to the one in May. When the stock corrected, it lead to a 10% drop. The retracement in Sept was just about 7%. Although not huge swing in these more boring stocks, one can still use the charts to their advantage if choosing to swing trade them. GLTA

I'm still holding DIS since my entry back in mid October. The run of the last two weeks could probably be attributed to the fund sheeple jumping in to pretent to their shareholders that they've been in DIS for months, lol. I'll be keeping an eye on the indicators now for a possilbe pullback. The FullSto is clearly in overbought territory while the MACDs are getting there too. Although not as critical with the Big Boards, when the indicators get too frothy in penny stocks, one can't hit the sell button too fast after a run into overbought levels. The current move in DIS is similar to the one in May. When the stock corrected, it lead to a 10% drop. The retracement in Sept was just about 7%. Although not huge swing in these more boring stocks, one can still use the charts to their advantage if choosing to swing trade them. GLTA

