Posted On: 01/01/2014 5:20:44 PM
Post# of 2561

COG Daily Chart ~ Waiting for a Reset
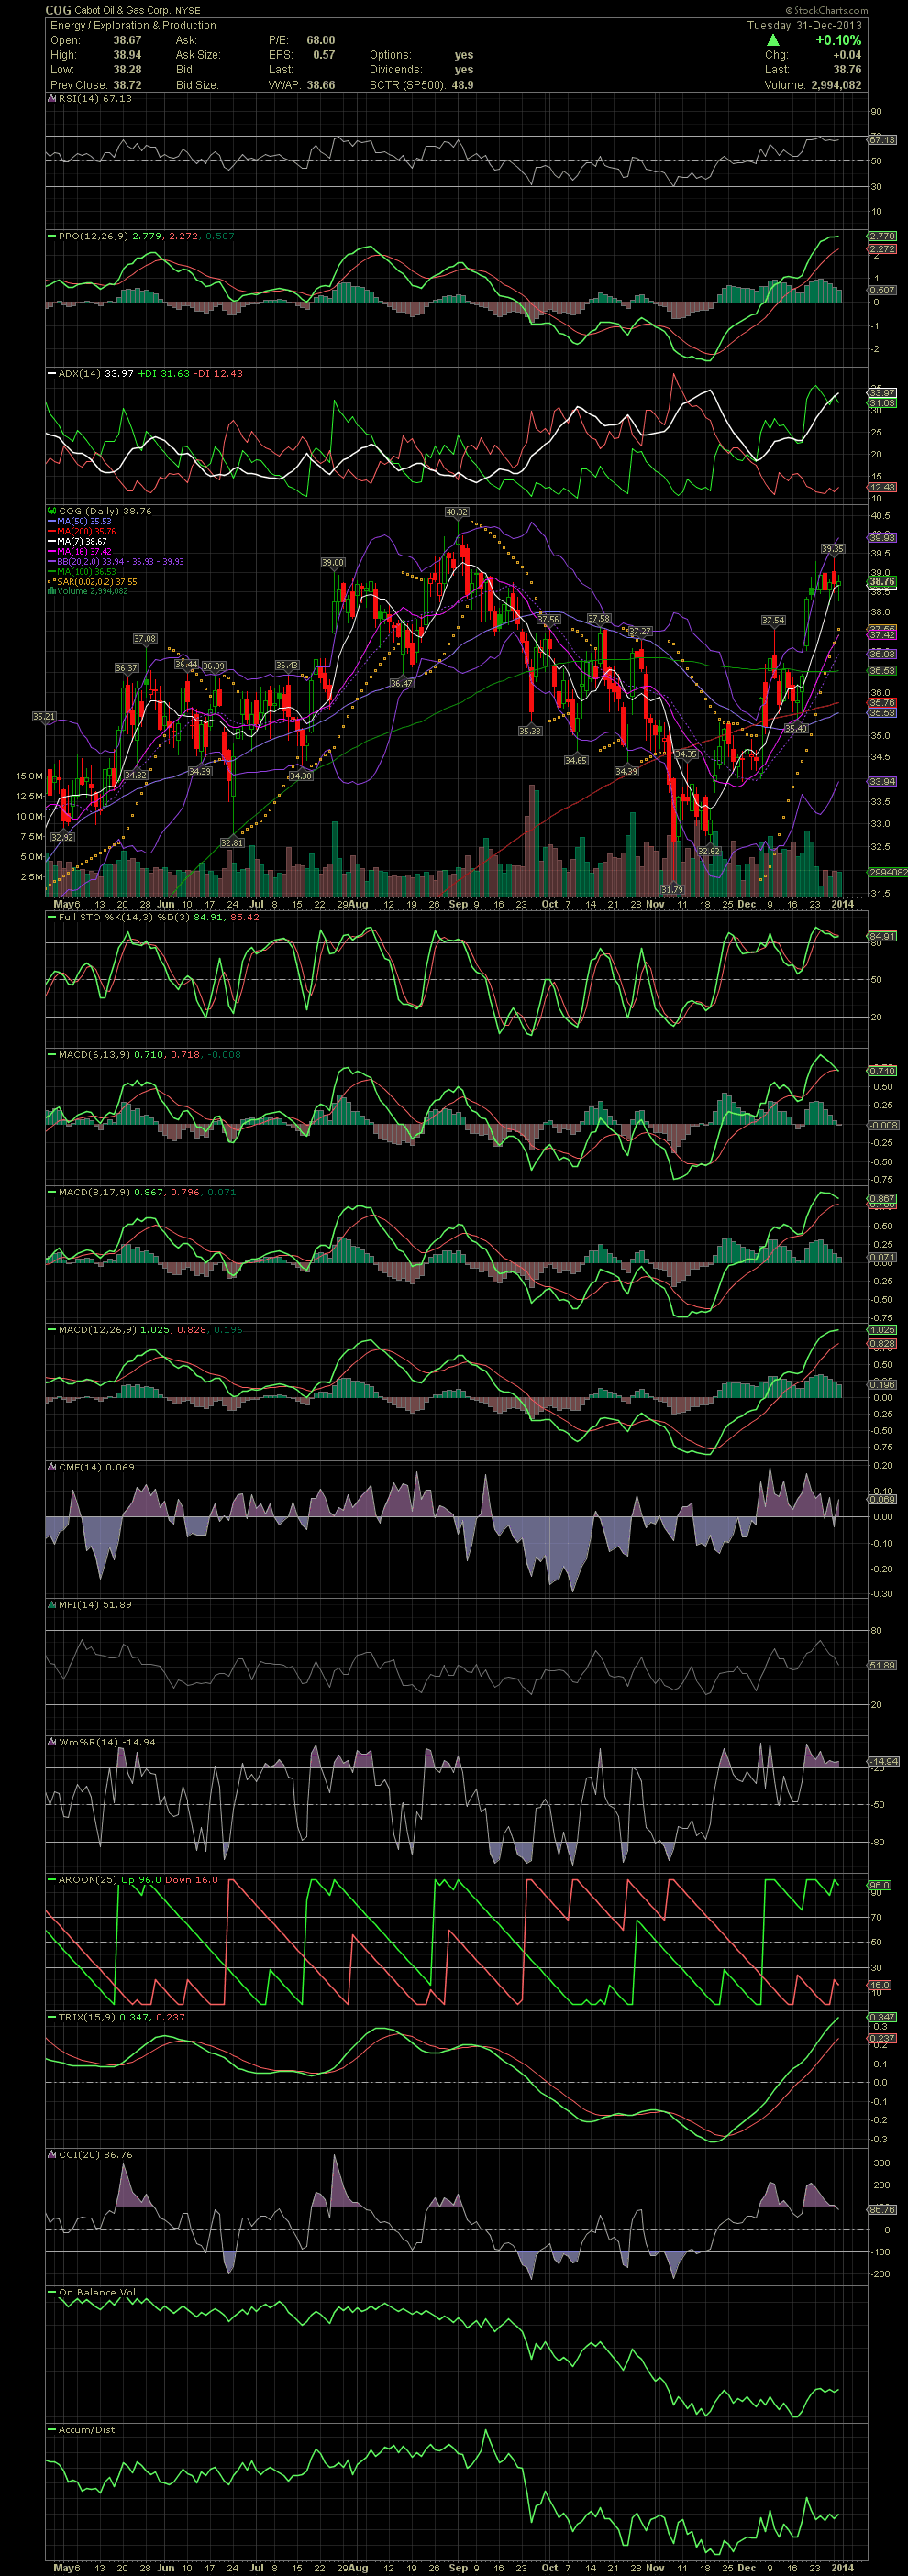
I forgot to mention COG last week when we exited the stock near 39.00. It was a nice swing trade from early Dec when the stock recaptured the MA20 in the 33.00s and oil prices began moving up again off the 93.00 level. Oil is now near 100.00 but already in the stock rise imo. The sideways trending is either a sign of consolidation prior to the next move up or distribution prior to another decline. In other words, I have no clue! Seeing how high the MACDs are and beginning their curl downwards, I'm more comfortable being out of the stock than in it. Previously the stock saw highs at 39.00 and 40.32 before dropping. Since the Big Boards are for the more conservative funds, it's always better to follow the charts when they begin topping. GLTA

I forgot to mention COG last week when we exited the stock near 39.00. It was a nice swing trade from early Dec when the stock recaptured the MA20 in the 33.00s and oil prices began moving up again off the 93.00 level. Oil is now near 100.00 but already in the stock rise imo. The sideways trending is either a sign of consolidation prior to the next move up or distribution prior to another decline. In other words, I have no clue! Seeing how high the MACDs are and beginning their curl downwards, I'm more comfortable being out of the stock than in it. Previously the stock saw highs at 39.00 and 40.32 before dropping. Since the Big Boards are for the more conservative funds, it's always better to follow the charts when they begin topping. GLTA

