Whether a company pays attention to the weather or not, it has an impact on the business.
Let's say it's been raining for a week and you own a retail store. There's no way you wouldn't notice a difference in foot traffic. It's a well-known fact that weather changes the way consumers behave, and there's even research to back that up.
|
As observed, weather can affect daily store sales by up to 23.1% depending on store location, and up to 40.7% depending on what’s currently being sold. – ScienceDirect, Journal of Retailing and Consumer Services |
The thing that's tricky about that is having to figure out exactly how much of an impact it has, and for that to happen, you need a lot more than a weather app on your phone.
You need weather data, like the kind Visual Crossing offers.

It provides historical records, forecasts, current conditions, solar, and other information related to weather that businesses and developers can work with. Instead of just showing that it'll be 25 degrees tomorrow, the service gives you the underlying data, which means it can be put into an app.
That way, you can compare it to your own numbers or use it as part of a larger analysis.
|
Adding weather information to retail forecasting models can help explain up to 47% of sales variance for individual products, and up to 56% for entire product categories. – ScienceDirect, Supply Chain Analytics |
The main part of the service is the Timeline Weather API. One thing that makes it especially convenient is that you can use the same API for past, present, and future weather. Historical records, current conditions, and forecasts are all part of the same ecosystem instead of being separate services. That's good to keep in mind because you never know when your needs might change. You might want forecasts for your dashboard now, but maybe later you'll decide that you want to compare those forecasts with a few years of historical conditions.
Luckily, that's a piece of cake because both are available through the same service, so there's no need to find another provider and then start from scratch.
When it comes to searching for locations, there's a lot of flexibility in terms of how that can be done. You can use addresses, ZIP codes, postal codes, latitude and longitude coordinates, and those are just some of the options you have at your disposal. You can specify dates and date ranges, too, which is important if you're trying to compare weather against business data from a particular period.
And you get to decide how much information you want back.
Visual Crossing gives you more than 100 weather elements, but that doesn't mean that every request needs them. Maybe all you care about is precipitation and temperature, or you have an energy company, and your priorities are wind and solar conditions.
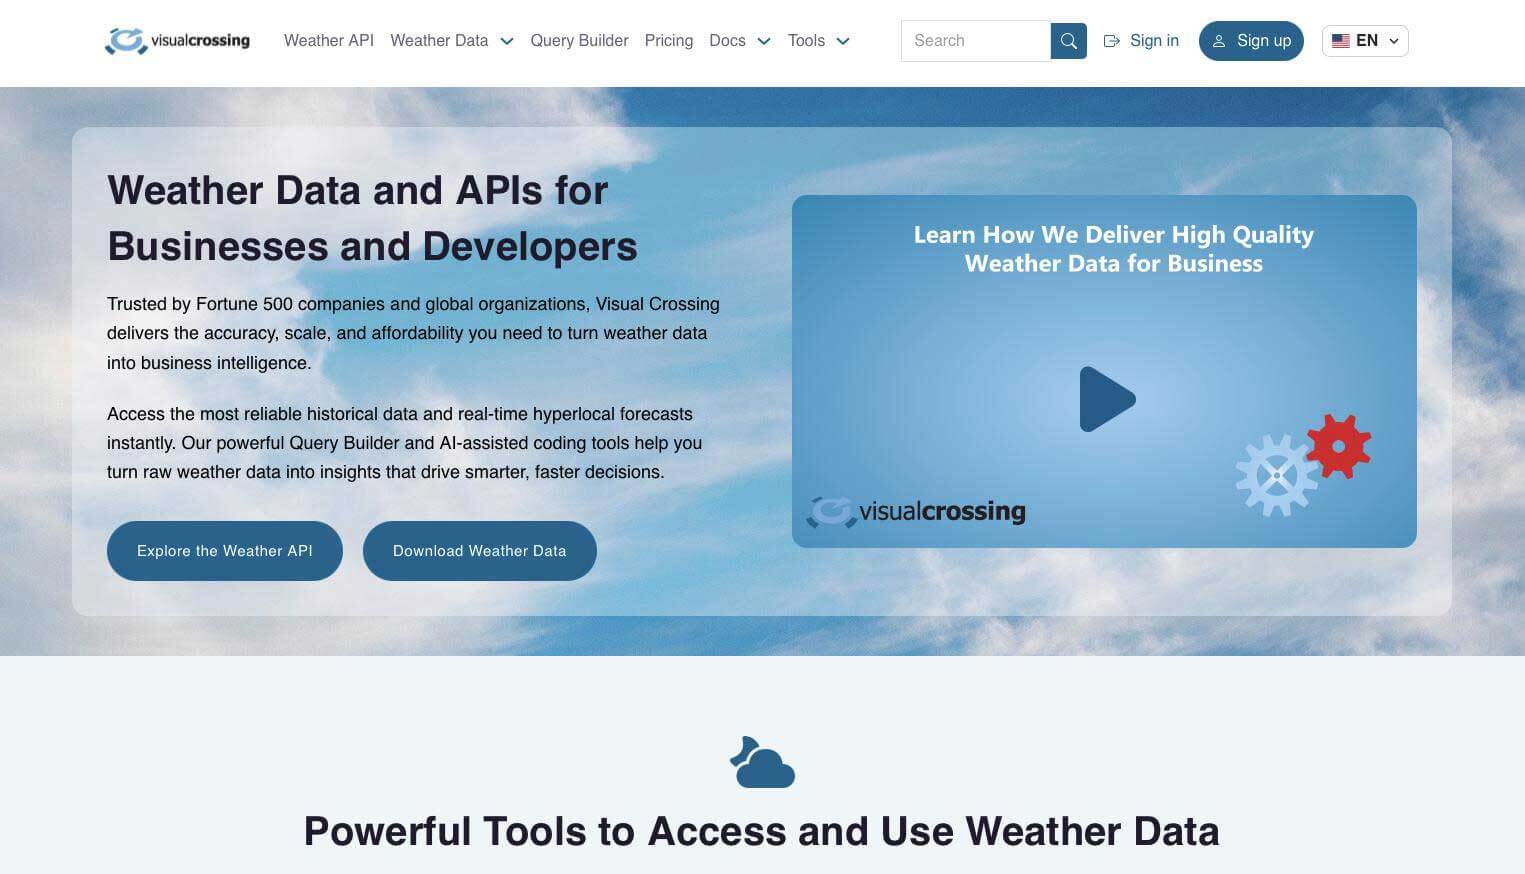
Some of the more familiar options are temperature, humidity, rainfall, wind, pressure, visibility, snow, and cloud cover. Once you have what you need, you can download it as JSON or CSV. JSON is what you'd want if the information was going straight into software, but if you're working with spreadsheets and databases, CSV is the obvious choice.
One of the most useful parts of Visual Crossing's service is historical data, especially if you were looking at it from a business perspective. You get more than 50 years of records, which means you have quite a bit to work with if you're trying to find long-term patterns.
Retail is an easy example of this because if you see sales jumping or falling under certain conditions, you can compare the conditions from years or decades ago with historical sales. Weather doesn't even have to be the main thing you're analyzing for this to be useful, though. Maybe you're trying to find an explanation for a weird sales period or demand for a certain product.
If you're able to add data as another factor, you have another thing to check instead of assuming that every change comes from pricing or marketing.
Quick Product Summary
-
Weather data available for locations around the world
-
More than 50 years of historical weather records
-
More than 100 weather elements to work with
-
REST-based API
-
JSON and CSV data formats
-
Locations can be searched for using addresses, ZIP codes, postal codes, coordinates, and other formats.
-
Weather Data Query Builder available for getting access to the data without working directly with the API
-
Free plan includes 1,000 weather records per day.
-
Specialized data for agriculture, energy, and climate analysis
-
MCP server for connecting weather data with compatible tools and apps
Products and Services
-
Timeline Weather API – The main API for getting historical weather records, forecasts, current conditions, and other information on the weather.
-
Timeline LLX – A low-latency option for applications that need forecast data quickly.
-
Weather Data Query Builder – A browser-based tool for searching, previewing, and downloading weather data without having to work manually with API requests.
-
Climate and Statistical Data – Longer-term weather statistics. Useful for research and data modeling.
-
MCP Server – Gives compatible AI tools and apps access to weather data through the Model Context Protocol
-
Bulk and Scheduled Weather Data – Larger datasets and scheduled delivery for businesses and projects that need information on weather on a regular basis.