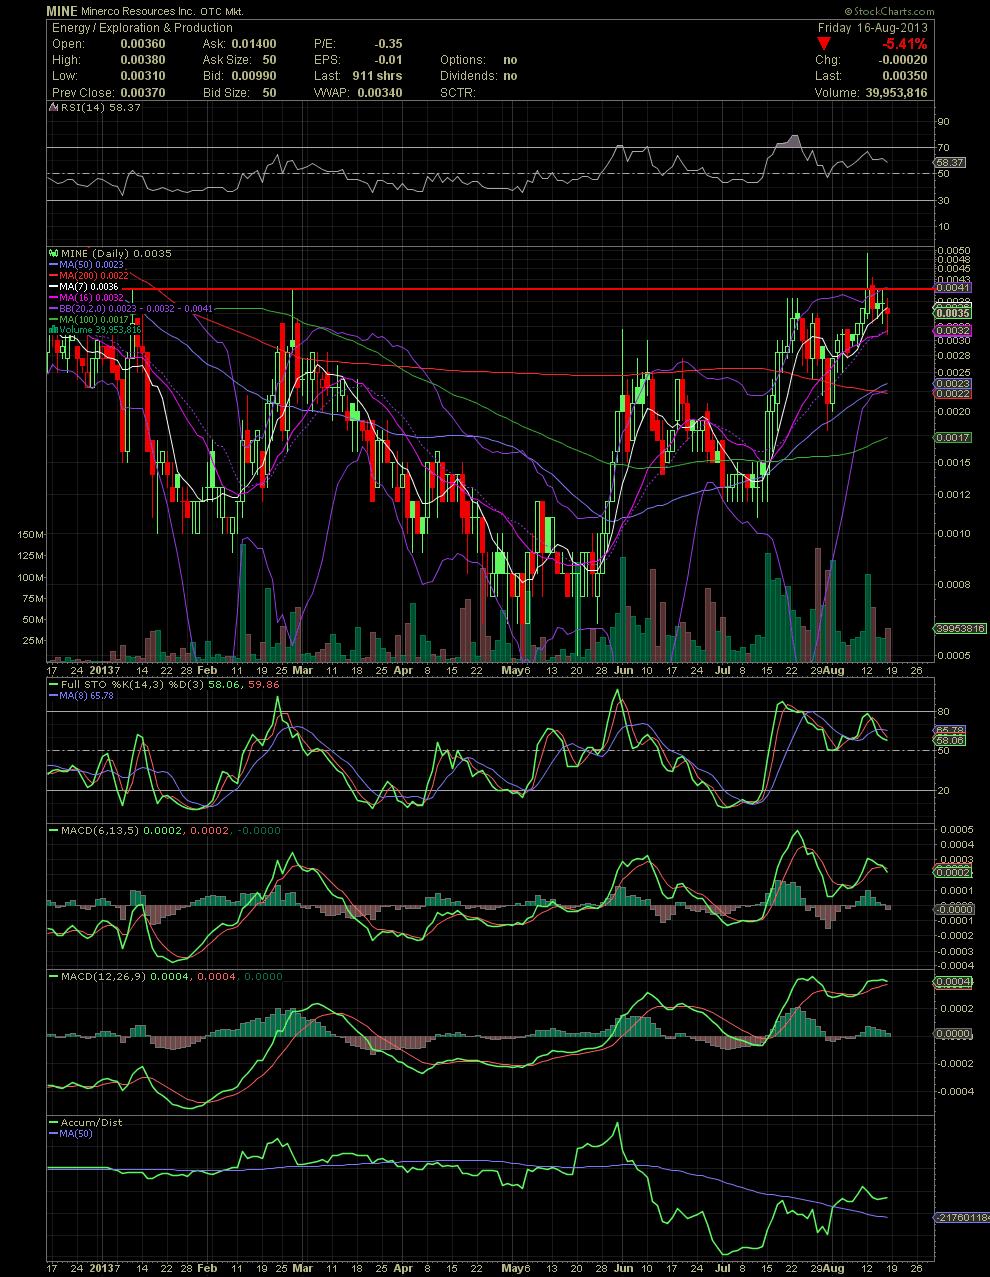
MINE Daily Chart ~ New high for MINE last Monda
Post# of 2561

New high for MINE last Monday, but unfortunately the stock ran way outside the upper bollie and was then prime for a pullback. A quick look at the chart this week would have showed the MA16 and 20 sitting at .0032. The stock touched .0031 Friday before rebounding to .0035 at the close. Most of the indicators are mixed due to the decline since .0049 on Monday, but overall, MINE looks very good for continued gains as news develops of their Level 5 products. If you are trading MINE, there have been plenty of opportunities to do so along the way. If you are still adding or just entering, use the indicators. moving averages and charts to help with a few decisions. What I would like to see next is a retest of the .004s and a close over .005 on big volume. That could bring a run to the .01 level quickly. I'll post a weekly chart in a few minutes after I post a one year chart, both for a better view of the big picture. GLTA

 (0)
(0) (0)
(0)