AGDY Daily Charts ~ Stock Hits a New High This Wee
Post# of 2561
Posted On: 08/18/2013 10:56:31 AM

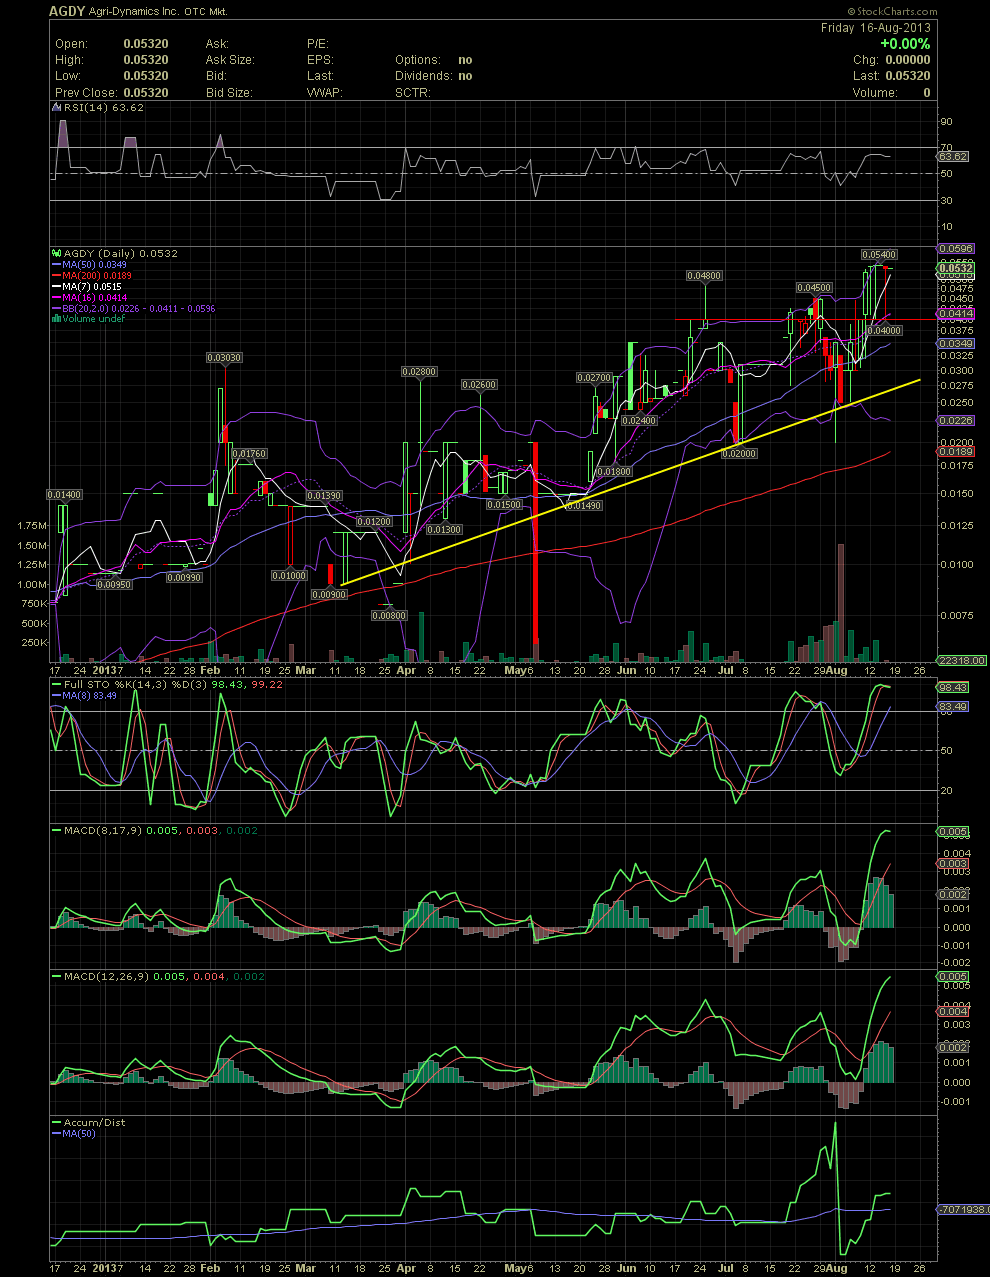
AGDY Daily Charts ~ Stock Hits a New High This Week and Holds It All Week
Here's another stock which I haven't been trading, so she's not a chart play. But a good looking chart will always help to attract a few. We've been accumulating AGDY since .006. Very boring stock, but up almost 900% so far with a lot more to come should management come thru with some oil acquisitions. With only approx 8.9 million shares in the float, this one will fly hugely on any solid news. One look at the chart, and anyone can see the channeling uptrend underway since March. A good day of volume here in AGDY is 200,000 shares. So like NXHZ, AGDY is a hard one to build a decent position in unless it's done over time. If I remember correctly, this week saw that a buy of 100,000 shares could have taken the stock to a dime, lol. Now THAT'S thin! If you bought AGDY with me since I first mentioned it, I hope you are still holding. It's a solid return to date, and I hope there's a lot more coming. The skull and crossbones were lifted a couple of weeks back, and AGDY is now Pink Current. The extremely low float also makes it very difficult to use the chart effectively unless you are trading a small position. Someone holding even just 500,000 shares would find it very difficult to swing trade such a position. But if you are looking to add to your position or just entering, I would seriously look at the .04 level a the new support line. A couple of weeks ago, it was my opinion that the .03 level would be a good place to put a few bids in at. That area held for the most part in late July/early August. Short term now, a break above .054 would be a good thing. But I wouldn't mind seeing a sideways move with .05 becoming a new support level. I don't see a lot of selling, but weeding out a few more sellers without the stock moving up, would at least allow the indicators, like the FullSto and MACDs to 'cool off' a little bit. Personally, I'm looking for the .20s by the end of Sept should management deliver. GLTA
Here's another stock which I haven't been trading, so she's not a chart play. But a good looking chart will always help to attract a few. We've been accumulating AGDY since .006. Very boring stock, but up almost 900% so far with a lot more to come should management come thru with some oil acquisitions. With only approx 8.9 million shares in the float, this one will fly hugely on any solid news. One look at the chart, and anyone can see the channeling uptrend underway since March. A good day of volume here in AGDY is 200,000 shares. So like NXHZ, AGDY is a hard one to build a decent position in unless it's done over time. If I remember correctly, this week saw that a buy of 100,000 shares could have taken the stock to a dime, lol. Now THAT'S thin! If you bought AGDY with me since I first mentioned it, I hope you are still holding. It's a solid return to date, and I hope there's a lot more coming. The skull and crossbones were lifted a couple of weeks back, and AGDY is now Pink Current. The extremely low float also makes it very difficult to use the chart effectively unless you are trading a small position. Someone holding even just 500,000 shares would find it very difficult to swing trade such a position. But if you are looking to add to your position or just entering, I would seriously look at the .04 level a the new support line. A couple of weeks ago, it was my opinion that the .03 level would be a good place to put a few bids in at. That area held for the most part in late July/early August. Short term now, a break above .054 would be a good thing. But I wouldn't mind seeing a sideways move with .05 becoming a new support level. I don't see a lot of selling, but weeding out a few more sellers without the stock moving up, would at least allow the indicators, like the FullSto and MACDs to 'cool off' a little bit. Personally, I'm looking for the .20s by the end of Sept should management deliver. GLTA
 (0)
(0) (0)
(0)