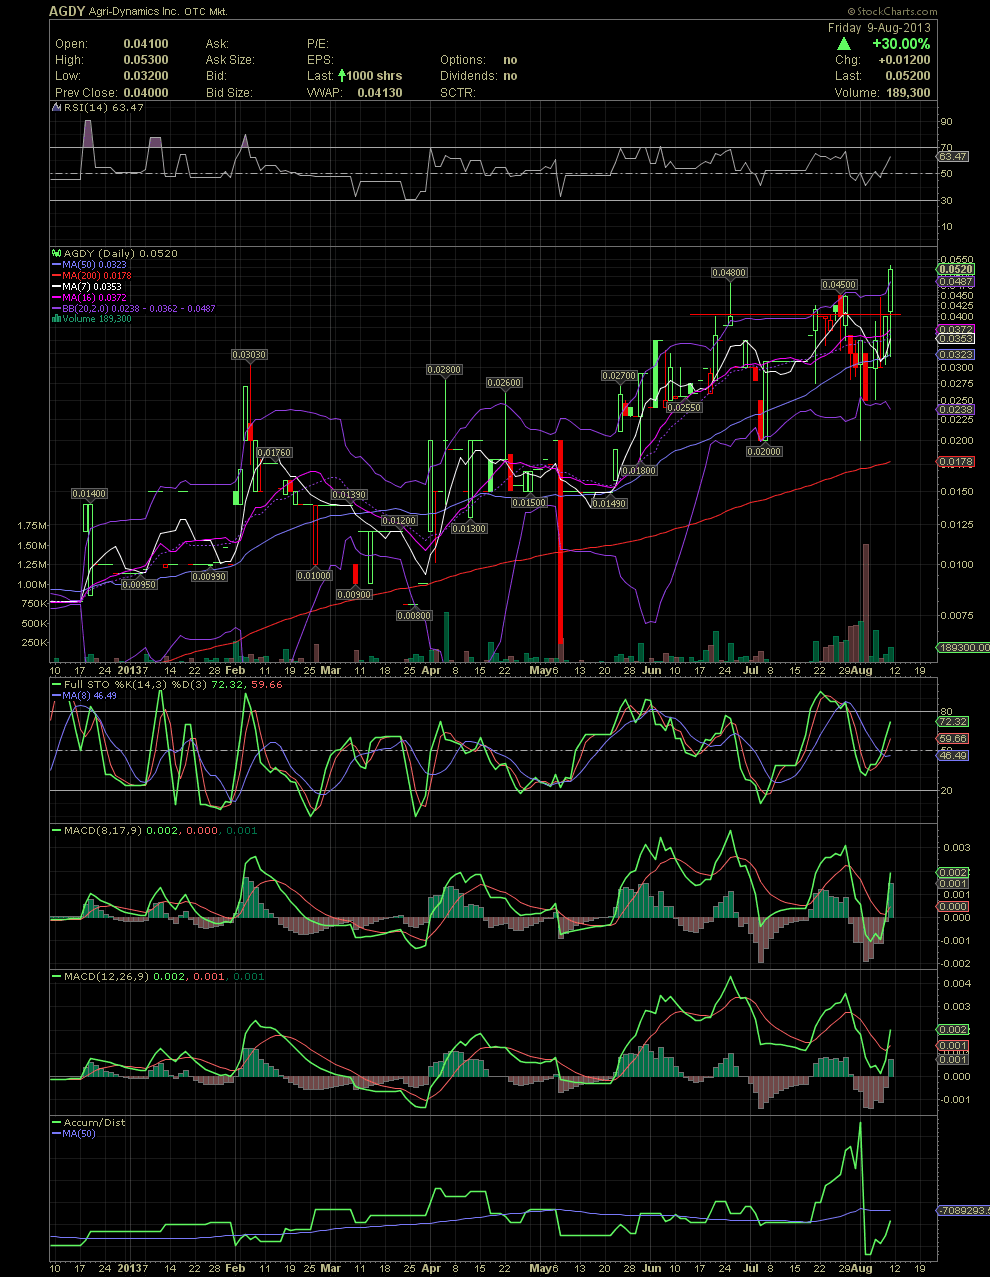
AGDY Daily Chart ~ The Rising Channel Continues to
Post# of 2561

AGDY hit another new high since we began accumulating sub .01 a few months ago. Up 30% on less than 190k traded. Those that continue to bid and accumulate have done well. The buying we did back in the .00s and .01s say that dry up the supply. That absorbing moved up into the .02s. The .02s became the .03s. As AGDY gets closer to their oil acquisitions, the .04s will probably become the new support level for those still bidding and adding. With only 8-9 mil shares in the float, AGDY could really fly on any material news. Management recently submitted the proper paperwork and filings to have the OTC Markets Skull and Crossbones removed and is now Current. A lot of chatter about .25 and higher looking out a few months. Let's see the material news!
As to the technicals, this isn't a chart play, but it's always nice to follow an excellent looking chart. Due to the low float and OS, any movement of share price in either direction is really amplified on the chart. This one is screaming 'A lot more to come!' While consistently appreciating over time, notice that the stock doesn't get extremely overbought as those accumulating are allowing the sellers, what few there are, to sell into the bids since April. As the selling dries up, those investing here have been gradually moving up their accumulation to higher levels once the selling has come to a crawl. GLTA

 (0)
(0) (0)
(0)