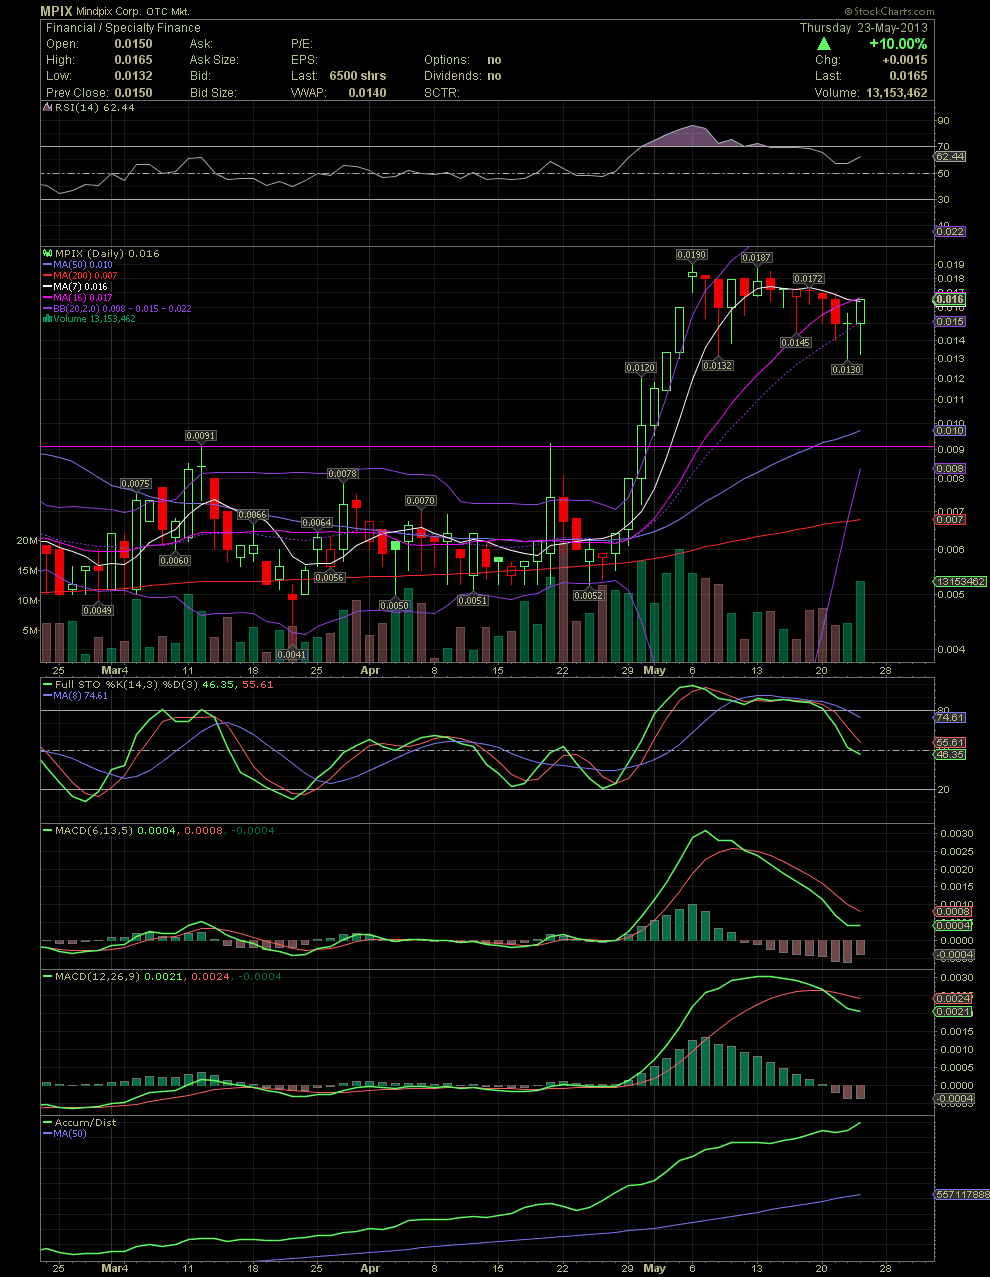
MPIX Daily Chart........A Close Up View I want
Post# of 5570

MPIX Daily Chart........A Close Up View
I wanted to share a more focused look at the daily chart to much better detail the various indicators that I discussed in my previous post. From the top down: Note the upward movement of the RSI after leveling out over the last couple of days. The stock closed at the high of the day at .0165 which is also where the MA7 and MA16 are. The MA20, represented by the dotted purple line, was sitting at .015. IMO, that's why so many sell orders were lined up in the .0149-.0151 asks over the last three days. When those prices where taken out, it was a very sharp and quick move to .0165. A lot of traders keep an eye on the MA20 as either resistance or support. Today that resistance point became a short term support level once the share price moved over it. Scrolling down to the FullSto and MACDs, one can see the declines already began to level out a little two days ago. But what I really like seeing is the continued acelleration of the A/D line at the bottom which moved dramatically higher during the consolidation and pullback of the last three weeks. Sweetness! GLTA

 (0)
(0) (0)
(0)