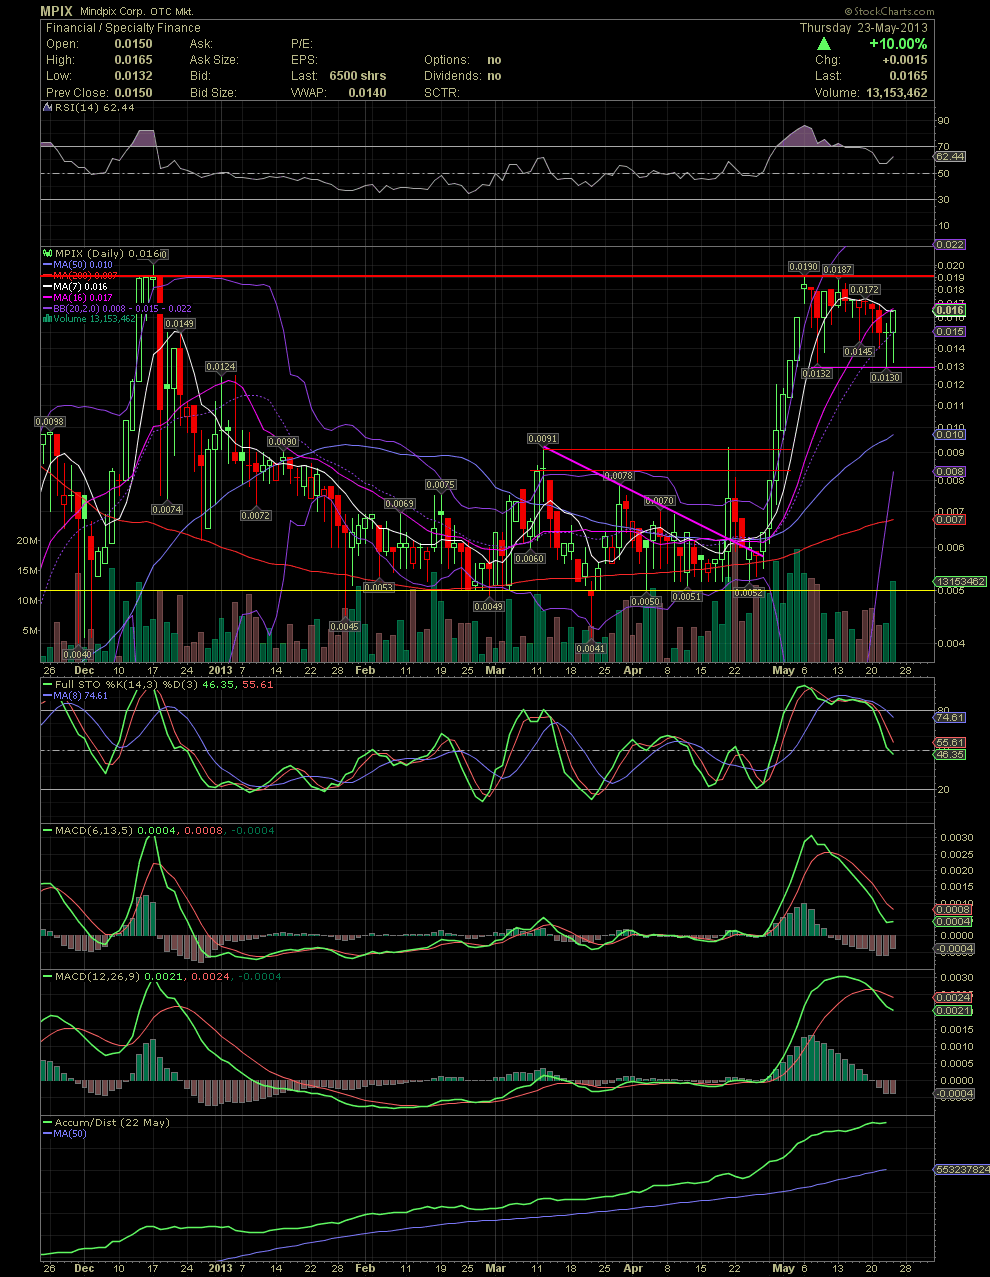
MPIX Daily Chart.............. Link Back to My Tho
Post# of 5570

MPIX Daily Chart.............. Link Back to My Thought's on Yesterday's Chart
Yet another day which saw the seller(s) hammer the stock down into the .013s intraday. Panic sellers, impatient sellers, or more shorts? Who cares! Most of the longer term MPIX shareholders used today's selling as yet another opportunity to accumulate even more stock. Congrats to my friends who snagged the .0132-.014s today!
As to the daily chart, as I mentioned yesterday, the intraday dips into the .013s have held since the second day after the recent run to .019. The support line (horizontal pink) held again. The bounce off that low of .0132 today witnessed a very strong recovery to a close of .0165. The 13.1 mil share day was the highest daily volume in almost 2.5 weeks. That's very indicative of the end of a consolidation phase, but I would like to see follow through tomorrow. The RSI has held above its 50 line so far. The FullSto is beginning to curl a bit near its 50 line. The faster MACD actually leveled out and began to ascend again. The longer term MACD, which is a bit slower in reacting to daily movement, is obviously still declining but no longer as overbought for three weeks ago. Today's close puts the closing price very close to the MA7 and 16 after blasting through the MA20 at .015. All good IMO. GLTA

 (0)
(0) (0)
(0)