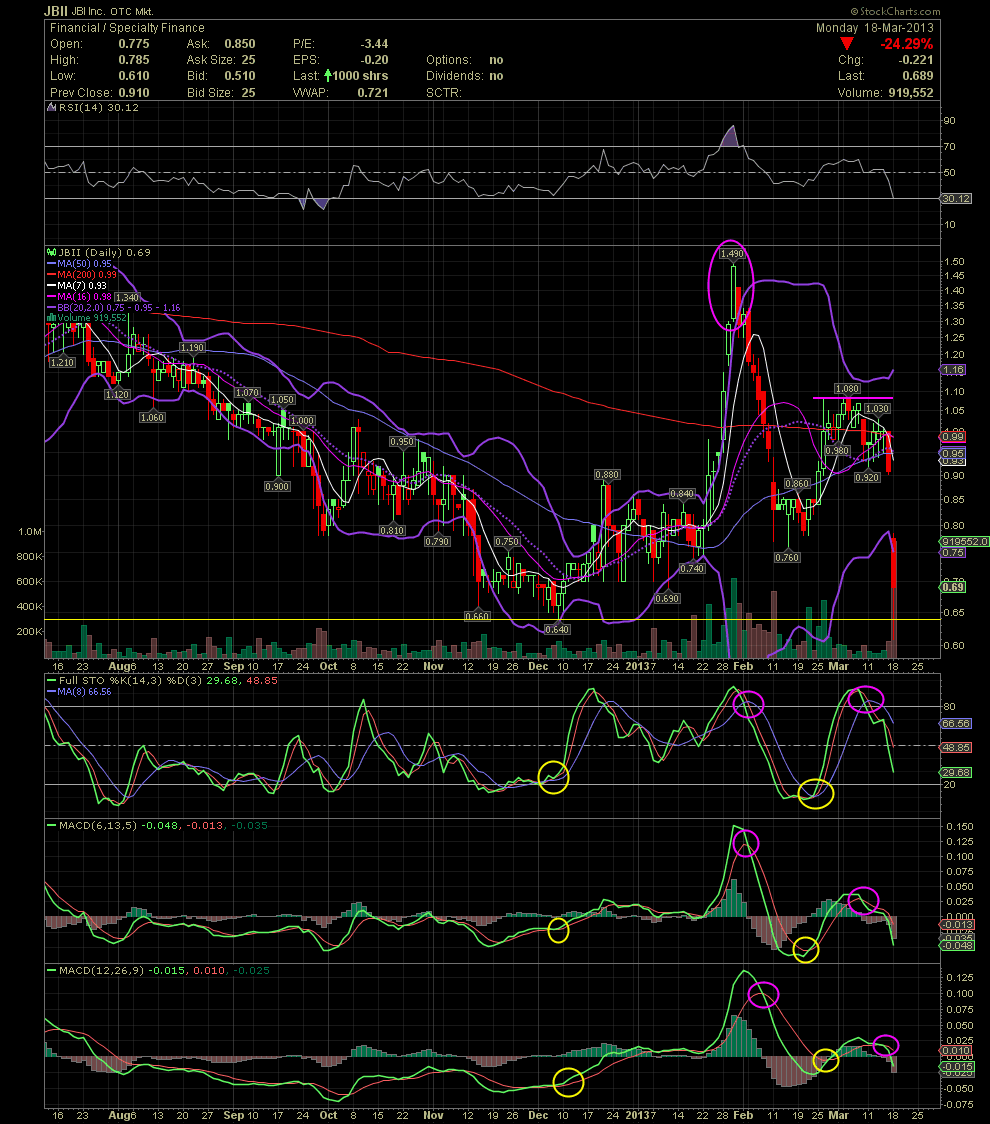
JBII Daily Chart....... Look Out Below Per my
Post# of 2561
JBII Daily Chart....... Look Out Below
Per my last JBII chart, I thought that the low .80s would be an opportunity to re-enter the stock. Fortunately for those sitting on the sidelines, the gap down to an open of .775, thus breaking under any low .80s support, should have kept one from jumping in. The lows of the December .60s may or may not offer support. Sometimes the best trade is no trade. Although the chart is quickly becoming oversold, let's wait for the indicators to settle into a better indication that a bottom might be in. Also, since there isn't nearly as much trading history on this daily chart, I'll post a weekly chart next which might offer a level that JBII might settle at. GLTA

 (0)
(0) (0)
(0)