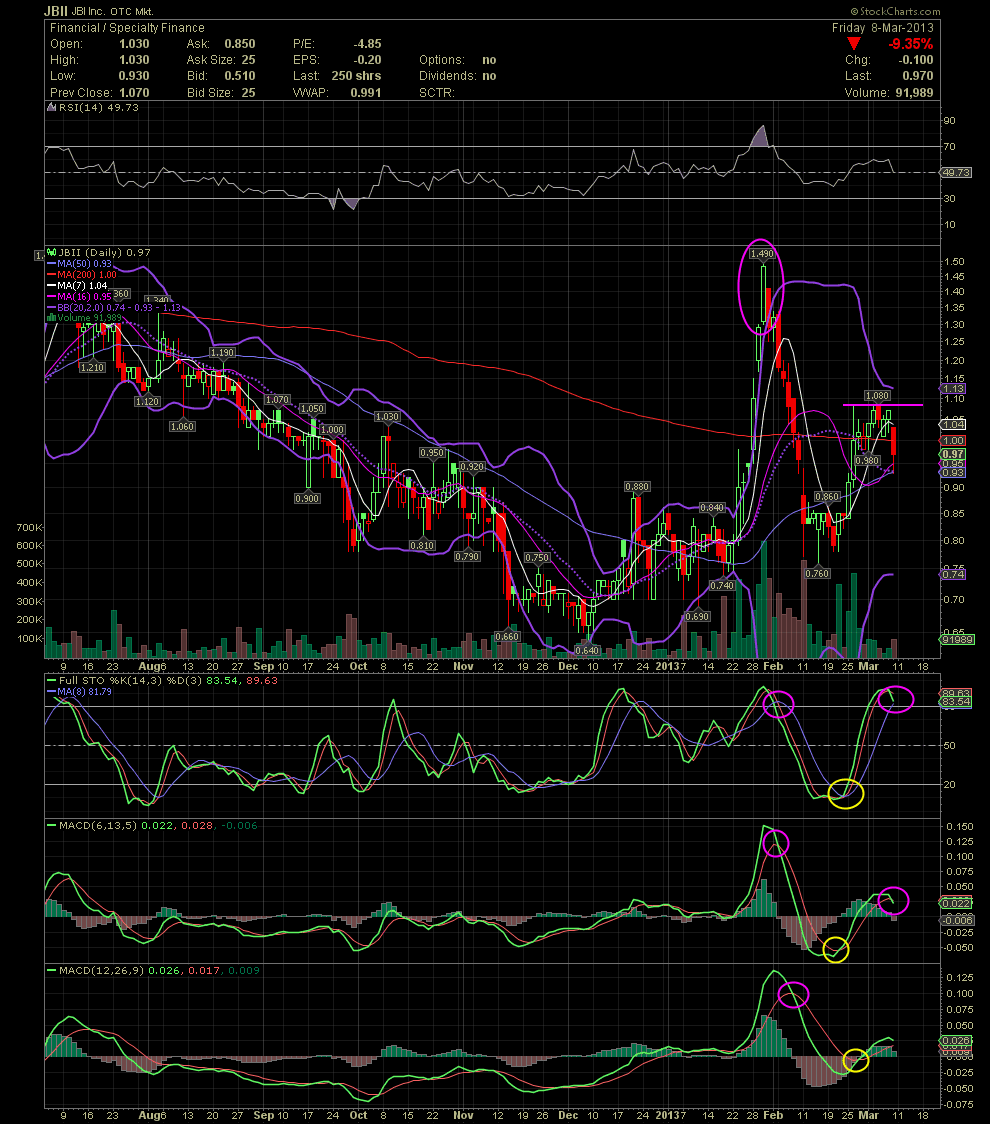
JBII Daily Chart....... Link Back to My March 3 JB
Post# of 2561

JBII Daily Chart....... Link Back to My March 3 JBII Post
The 1.08 hit two weeks ago has proven to be a short term top and resistance. I sold the balance of mine this week when a couple of indicators went negative and the price dropped below some moving averages. The stock might find some support at the MA16, 20 and 50 which are all sitting at .93-.95. Should that be broken, I would look to the low .80s to .88 as another opportunity to re-entry and bank once again. GLTA

 (0)
(0) (0)
(0)