GSB Daily Chart.......... A Typical Breakout React
Post# of 2561

GSB Daily Chart.......... A Typical Breakout Reaction
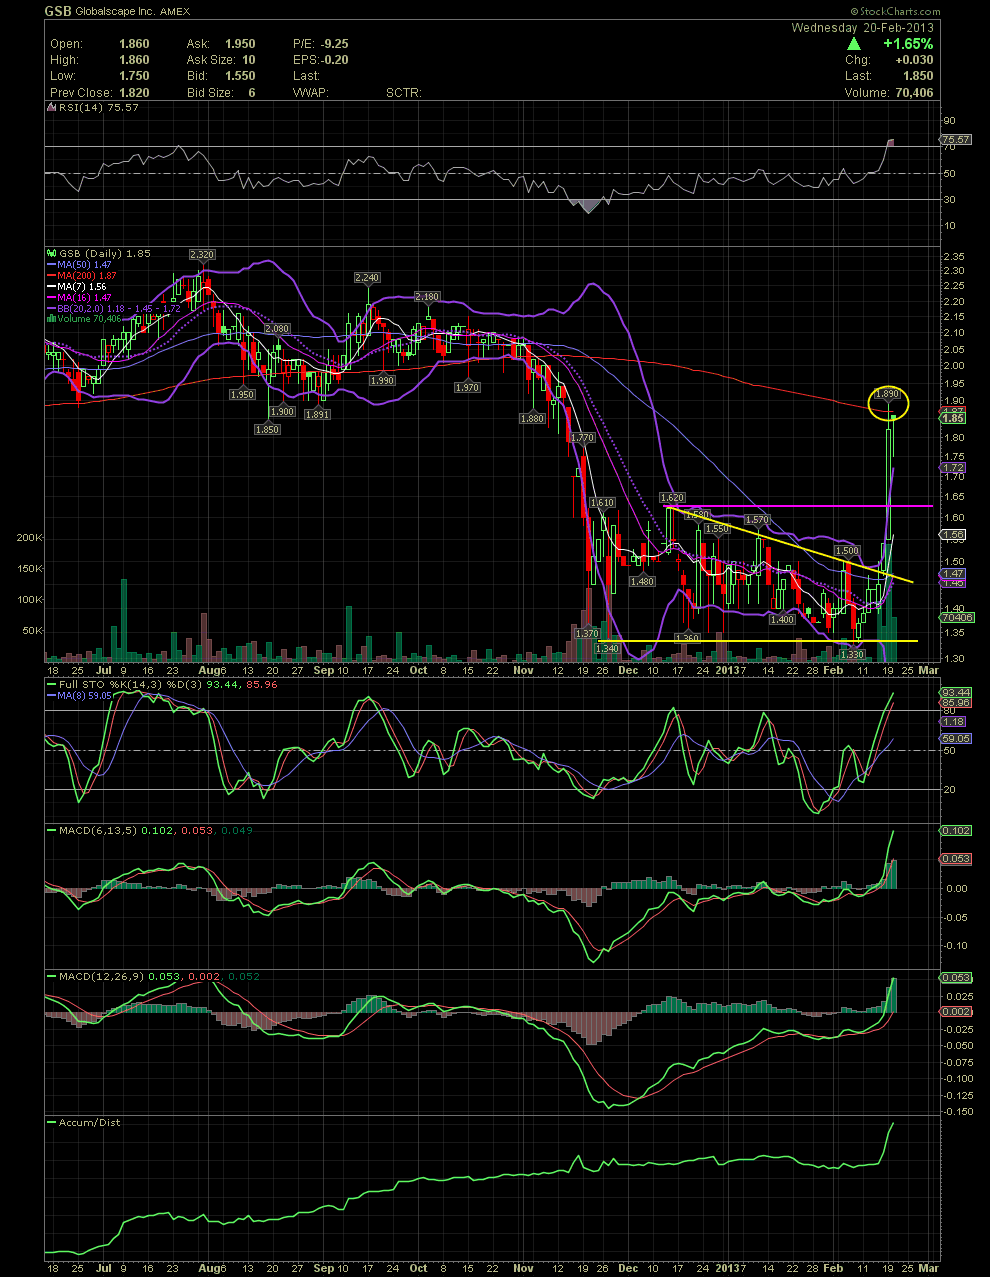
GSB is my current pick for the Investors Hangout Big Board Contest at 1.54, which was Friday's closing price. I purchased GSB early last week after a successful test of the low 1.30s (lower yellow line). What we saw there was a double bottom possibility from the lows of late Nov and last week. I mentioned to a few that the stock needed to break above the declining tops line (upper yellow line) near the mid 1.40s. The stock moved above that line on Friday and closed at 1.54. The FullSto and MACD movements during the trading between the yellow lines indicated that a bottom was near. So that retest of the 1.30s made for a calculated risk entry for a few of us.
Although a sharper move that I actually expected this week, it did exactly what I believed would come next, that being a test of the MA200 in the high 1.90s. No surprise to me that the stock was halted in its tracks at the 200. One can see the attempts of Tue and Wed and the resistance it encountered. For those that sold with me at the 200, congrats on your less than one week profits of almost 40%. Not bad for a big board stock. Unfortunately for me, the contest is a two week hold, so I'm hoping for more upside even though I sold the stock already.

 (0)
(0) (0)
(0)