Investors Hangout Stock Message Boards Logo
  • Mailbox
  • Favorites
  • Boards
    • The Hangout
    • NASDAQ
    • NYSE
    • OTC Markets
    • All Boards
  • Whats Hot!
    • Recent Activity
    • Most Viewed Boards
    • Most Viewed Posts
    • Most Posted
    • Most Followed
    • Top Boards
    • Newest Boards
    • Newest Members
  • Blog
    • Recent Blog Posts
    • Recently Updated
    • News
    • Stocks
    • Crypto
    • Investing
    • Business
    • Markets
    • Economy
    • Real Estate
    • Personal Finance
  • Market Movers
  • Interactive Charts
  • Login - Join Now FREE!
  1. Home ›
  2. Stock Message Boards ›
  3. User Boards ›
  4. Big Tuna's Stocks Message Board

CADY Daily Chart............... Ok, CADY is a

Message Board Public Reply | Private Reply | Keep | Replies (0)                   Post New Msg
Edit Msg () | Previous | Next


Post# of 2561
Posted On: 02/21/2013 8:03:22 AM
Avatar
Posted By: Big Tuna

CADY Daily Chart...............


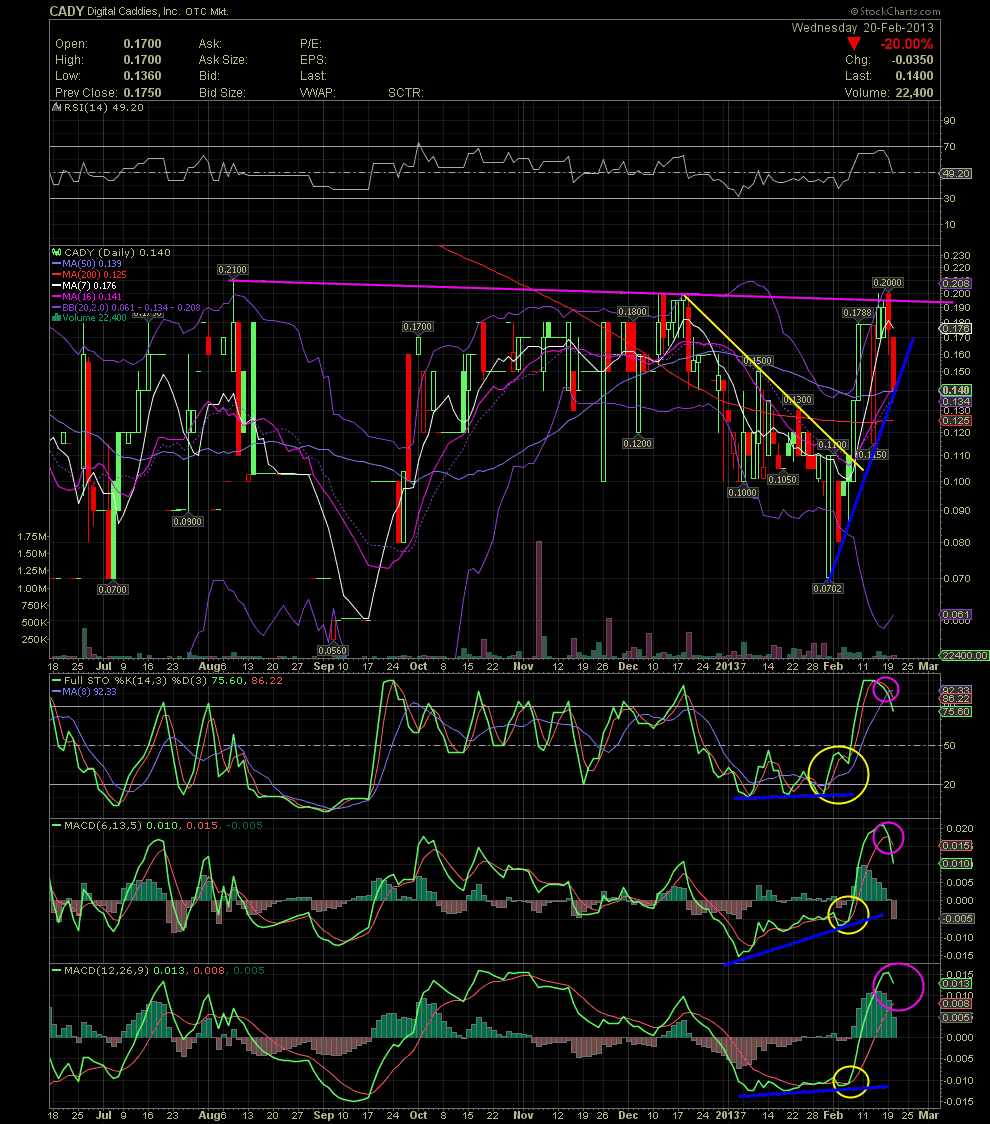
Ok, CADY is a tough one due to very low volume, and that makes charting and tech work on an illiquid stock hard due to volatility. But I promised a friend that I would post a CADY chart for him.


As I mentioned, one can clearly see the very low volume here. That makes swing trading a stock like CADY very difficult with any position of size unless one is holding for the longer term, which a few of us are. The problem with a larger position comes when you try to sell a lot of stock, because you will pretty much make the market on your own. Still, opportunities do arise when one has to take a position in a stock when the fundamentals warrant it. And the technicals do offer some valuable information to better time ones entries and exits.


With CADY, you can see the decline in the share price from mid Dec into late Jan. One should also note the divergence in the FullSto and MACDs during the decline. That was signaling that a bottom would more than likely be in shortly with a subsequent reversal to the upside. I've circled, in yellow, the things that I look for as to the crossovers in the FullSto and MACD. I also drew in the declining top line (pink) which was established early Aug and mid Dec with the two tops. The test of that line failed and the stock sold off over the last two days. So far the share price is holding the rising support line and the MA50. I also circled (pink) the sell signals of the FullSto and faster MACD. The slower MACD hasn't given a sell signal yet, but she's definitely curling to the downside. I have to caution, though, that since CADY is so thinly traded, the indicators move very quickly in both directions. So should any material news come from the company, the stock price could reverse very quickly to the upside. That said, I like the fundamentals of CADY, and I believe the stock will be trading in the .35-.50 range over the next few months. GLTA


(0)
(0)


Investors Hangout

Home

Mailbox

Message Boards

Favorites

Whats Hot

Blog

Settings

Privacy Policy

Terms and Conditions

Disclaimer

Contact Us

Whats Hot

Recent Activity

Most Viewed Boards

Most Viewed Posts

Most Posted Boards

Most Followed

Top Boards

Newest Boards

Newest Members

Investors Hangout Message Boards

Welcome To Investors Hangout

Stock Message Boards

American Stock Exchange (AMEX)

NASDAQ Stock Exchange (NASDAQ)

New York Stock Exchange (NYSE)

Penny Stocks - (OTC)

User Boards

The Hangout

Private

Global Markets

Australian Securities Exchange (ASX)

Euronext Amsterdam (AMS)

Euronext Brussels (BRU)

Euronext Lisbon (LIS)

Euronext Paris (PAR)

Foreign Exchange (FOREX)

Hong Kong Stock Exchange (HKEX)

London Stock Exchange (LSE)

Milan Stock Exchange (MLSE)

New Zealand Exchange (NZX)

Singapore Stock Exchange (SGX)

Toronto Stock Exchange (TSX)

Contact Investors Hangout

Email Us

Follow Investors Hangout

Twitter

YouTube

Facebook

Market Data powered by QuoteMedia. Copyright © 2025. Data delayed 15 minutes unless otherwise indicated (view delay times for all exchanges).
Analyst Ratings & Earnings by Zacks. RT=Real-Time, EOD=End of Day, PD=Previous Day. Terms of Use.

© 2025 Copyright Investors Hangout, LLC All Rights Reserved.

Privacy Policy |Do Not Sell My Information | Terms & Conditions | Disclaimer | Help | Contact Us