Investors Hangout Stock Message Boards Logo
  • Mailbox
  • Favorites
  • Boards
    • The Hangout
    • NASDAQ
    • NYSE
    • OTC Markets
    • All Boards
  • Whats Hot!
    • Recent Activity
    • Most Viewed Boards
    • Most Viewed Posts
    • Most Posted
    • Most Followed
    • Top Boards
    • Newest Boards
    • Newest Members
  • Blog
    • Recent Blog Posts
    • Recently Updated
    • News
    • Stocks
    • Crypto
    • Investing
    • Business
    • Markets
    • Economy
    • Real Estate
    • Personal Finance
  • Market Movers
  • Interactive Charts
  • Login - Join Now FREE!
  1. Home ›
  2. Stock Message Boards ›
  3. User Boards ›
  4. Big Tuna's Stocks Message Board

MINE Daily Chart......... A Breakout is Possibly U

Message Board Public Reply | Private Reply | Keep | Replies (0)                   Post New Msg
Edit Msg () | Previous | Next


Post# of 2561
Posted On: 02/21/2013 7:02:04 AM
Avatar
Posted By: Big Tuna

MINE Daily Chart......... A Breakout is Possibly Underway


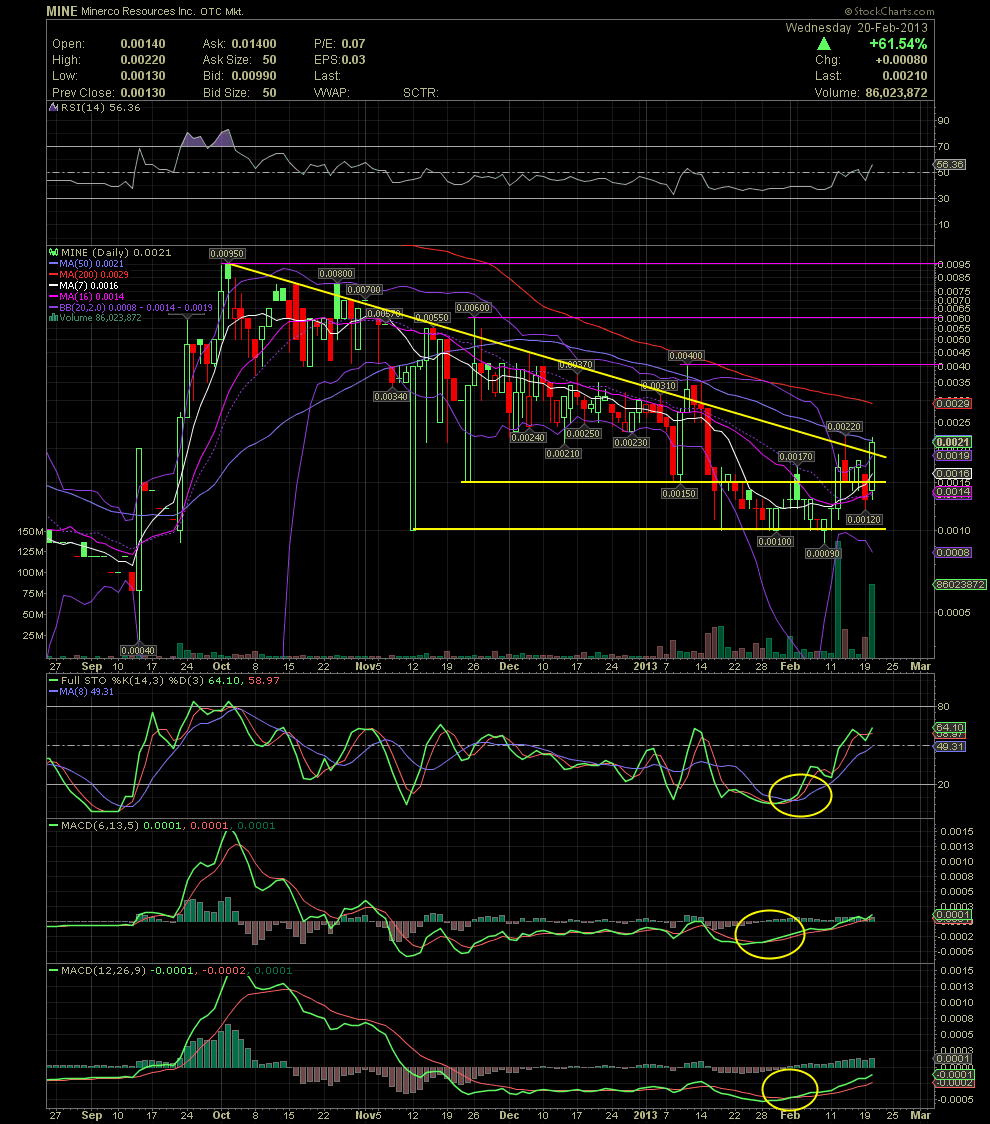
For those of you on my email list or that have been following along, we've been accumulating MINE for a few weeks now while the stock was channeling between .001 to .0015 (two yellow horizontal lines). The failed breakout of early Feb was followed with a retest of the .001 level. The long term declining tops line (upper yellow) has been acting as major resistance for months. As I mentioned to many over the last week, MINE will need to break above that line, on strong volume, and close at a minimum of .02. That was done yesterday. Now let's see if the sharp rise of yesterday is in fact the breakout that I've been hoping for. For those that are learning charting and technical analysis, please note the oversold levels of the FullSto and MACDs. I've also circled the crossovers that I look for when upside momentum is about to happen from these oversold conditions. When all three occur near the same time from these oversold conditions, it often leads to a sharp bounce or even a sustained move to the upside. Some of the shorter term moving averages have also crossed to confirm a buy signal, such as the MA7 crossover of the MA16. Should the next couple of trading days do what I believe is about to happen, then look for a test of the MA200 (red) at .0029 along with possible tests of the horizontal targets (pink lines). There also appears to be some strong corporate news pending which could be the catalyst for a move into the pennies over the next 1-3 months. GLTA


(0)
(0)


Investors Hangout

Home

Mailbox

Message Boards

Favorites

Whats Hot

Blog

Settings

Privacy Policy

Terms and Conditions

Disclaimer

Contact Us

Whats Hot

Recent Activity

Most Viewed Boards

Most Viewed Posts

Most Posted Boards

Most Followed

Top Boards

Newest Boards

Newest Members

Investors Hangout Message Boards

Welcome To Investors Hangout

Stock Message Boards

American Stock Exchange (AMEX)

NASDAQ Stock Exchange (NASDAQ)

New York Stock Exchange (NYSE)

Penny Stocks - (OTC)

User Boards

The Hangout

Private

Global Markets

Australian Securities Exchange (ASX)

Euronext Amsterdam (AMS)

Euronext Brussels (BRU)

Euronext Lisbon (LIS)

Euronext Paris (PAR)

Foreign Exchange (FOREX)

Hong Kong Stock Exchange (HKEX)

London Stock Exchange (LSE)

Milan Stock Exchange (MLSE)

New Zealand Exchange (NZX)

Singapore Stock Exchange (SGX)

Toronto Stock Exchange (TSX)

Contact Investors Hangout

Email Us

Follow Investors Hangout

Twitter

YouTube

Facebook

Market Data powered by QuoteMedia. Copyright © 2025. Data delayed 15 minutes unless otherwise indicated (view delay times for all exchanges).
Analyst Ratings & Earnings by Zacks. RT=Real-Time, EOD=End of Day, PD=Previous Day. Terms of Use.

© 2025 Copyright Investors Hangout, LLC All Rights Reserved.

Privacy Policy |Do Not Sell My Information | Terms & Conditions | Disclaimer | Help | Contact Us